

Understanding Bearish Candlestick Patterns
📉 Learn how bearish candlestick patterns signal possible market dips. Get tips to spot, interpret, and use them smartly in trading decisions.
Edited By
Charlotte Moore
Bullish candlestick patterns are key tools for traders seeking to make smart moves in both Nigerian and global markets. These patterns provide a snapshot of market sentiment, signalling when prices are likely to rise after a period of decline. Recognising these patterns can give you an edge, helping you enter or exit trades at better moments.
A candlestick shows four price points: open, high, low, and close, within a specific timeframe. When the closing price is higher than the opening price, the candle is typically bullish, indicating buyers are in control. Several formations of these bullish candles reveal different types of buying pressure and potential upward momentum.
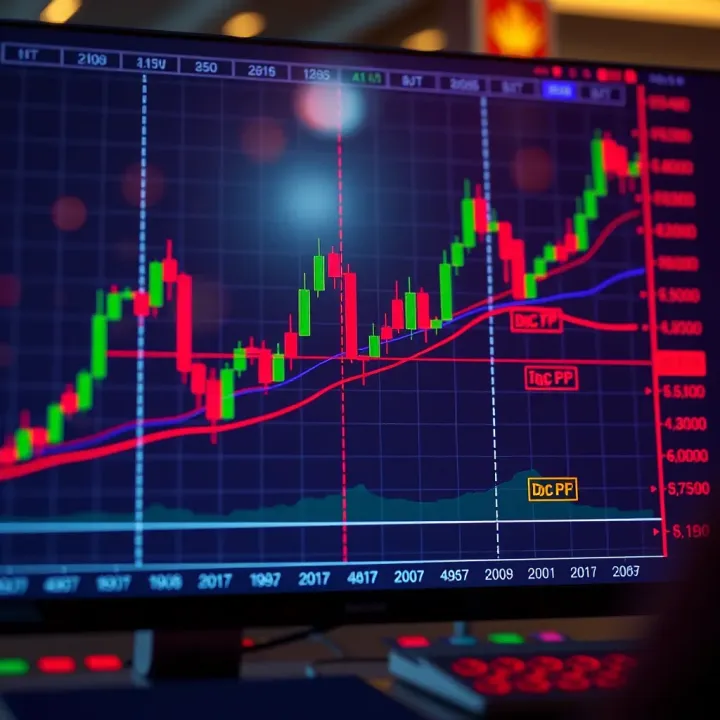
Some popular bullish candlestick patterns include:
Hammer: A candle with a small body and a long lower wick, suggesting sellers pushed prices down but buyers regained control by closing near the open. This often appears at market bottoms.
Bullish Engulfing: A large bullish candle that completely covers the previous bearish candle, signalling a strong shift from sellers to buyers.
Morning Star: A three-candle pattern where a bearish candle is followed by a small-bodied candle, then a large bullish candle. This pattern indicates a clear reversal from downtrend to uptrend.
Spotting these patterns requires careful observation over daily or weekly charts, especially in volatile Nigerian markets where sudden price jumps can occur due to local events or economic announcements.
Combining candlestick analysis with other tools like volume and moving averages increases confidence when making trading decisions. For example, a bullish hammer that forms near a strong support level with rising volume enhances the signal’s reliability.
Understanding these patterns isn’t just for expert traders. Even beginners can apply them to better time their trades, reduce losses, and increase profitability. Nigerian traders should consider integrating these insights with their knowledge of local market peculiarities, such as naira fluctuations and periodic fuel scarcity, to navigate price changes effectively.
In the next sections, we will explore each key bullish pattern in detail, supported by real market examples and practical tips on how to use them.
Bullish candlestick patterns form the foundation of technical analysis by revealing market behaviour through graphical price data. Understanding these basics equips traders to recognise when buyers are gaining strength, which can guide their decisions effectively. In practical terms, mastering these patterns helps traders anticipate upward price moves, a skill especially valuable in volatile markets like Nigeria’s equities sector.
These four prices create the candlestick’s shape and provide crucial clues. The opening price marks the start of the trading period, while the closing price marks its end. For a bullish candlestick, the close must be higher than the open, showing the price increased over that period. The high and low depict the highest and lowest traded prices, shaping the candlestick's overall range.
For example, if a stock in the NGX opened at ₦50 and closed at ₦55 with a high of ₦56 and a low of ₦49, the resulting bullish candle suggests buying pressure pushed the price upward despite fluctuations.
The “body” represents the range between the open and close prices. A longer body indicates stronger buying momentum within that session. The “wick” (also called shadows) refers to the thin lines above and below the body showing the highest and lowest trades.
A long lower wick with a small body near the top signals buyers stepped in after price dipped, an important detail to watch for reversals or support levels. Nigerian traders who spot such formations during ember months might identify promising entry points amid seasonal volatility.
Bullish candles confirm that buying pressure exceeded selling within the period—usually a green or white candle on charts. Bearish candles, in contrast, signal selling dominance with close prices lower than open. Recognising the difference lets traders judge market sentiment quickly.
In Nigerian markets, where investor behaviour can shift fast due to macroeconomic announcements or policy changes, distinguishing bullish from bearish candles helps adapt strategies swiftly.
Bullish candlestick patterns often reflect growing confidence among buyers, marking the start or continuation of upward trends. This momentum helps traders decide when to enter positions with higher chances of profit.
Consider a stock regularly forming bullish patterns alongside increased NGX volume—such signals suggest the stock might gain from sustained investor interest.
Certain bullish formations appear after downtrends, signalling mood shifts and potential price reversals. Identifying these early can save traders from losses and open opportunities for gains.
For instance, a hammer candlestick appearing after consecutive bearish candles might indicate the bulls are taking charge, prompting traders to consider buying.
Nigerian markets experience cycles influenced by political events, CBN policies, and seasonal factors like the ember months, when trading activity spikes. Bullish candle patterns must be read with this context in mind.
A bullish pattern during ember months might carry stronger implications due to higher market participation. Conversely, sudden bullish moves during policy uncertainty need confirmation with volume and other indicators to avoid false signals.
Understanding the basics of bullish candlestick patterns is about more than charts—it's about reading market psychology, aligning signals with local dynamics, and making smarter trading decisions in an ever-shifting environment.
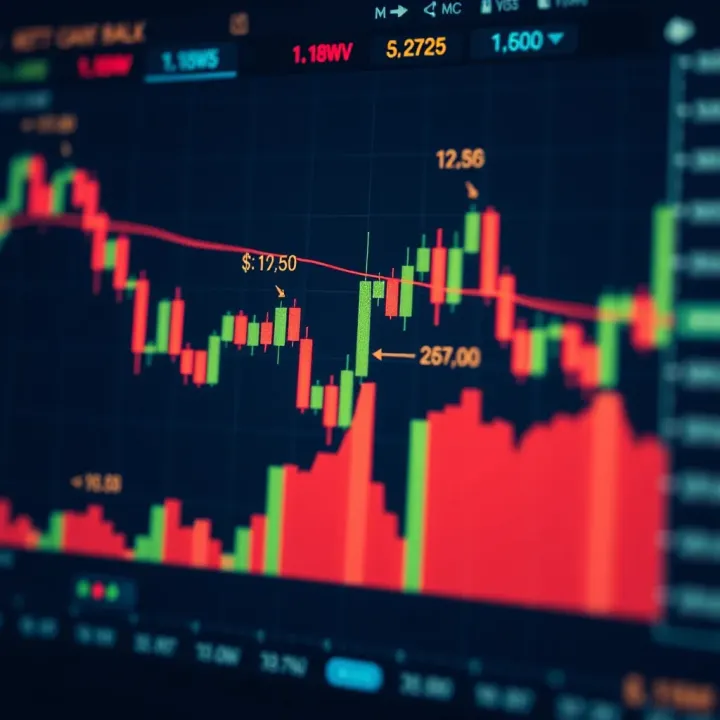
Understanding common bullish candlestick patterns is essential for traders looking to spot potential entry points and positive momentum shifts in the market. These patterns offer clues on when buyers are gaining control, which can improve timing and boost trading decisions significantly.
Identifying the Hammer: The hammer is a single candle pattern that signals a possible bullish reversal after a downward trend. It features a small body near the top and a long lower wick, showing that sellers pushed the price down during the session but buyers regained control before close. The appearance of a hammer often attracts traders looking to enter long positions on the hope that the price will bounce.
Why the Hanging Man Differs: Though the hanging man looks similar to the hammer, it occurs after an uptrend, warning traders of a potential bearish reversal. The long lower wick reflects selling pressure, but the inability of buyers to defend aggressively may indicate weakness. Recognising this pattern helps avoid buying when the market is starting to cool off.
How to Interpret Hammer Patterns: Interpreting the hammer requires confirmation from the following candles or other indicators like volume. When a hammer appears after a downtrend with rising volume, it suggests increasing buyer interest. Traders may use this signal to place buy orders with stops just below the wick to manage risk.
Formation and Characteristics: The bullish engulfing pattern involves two candles: a small bearish candle followed by a larger bullish candle that completely covers the previous candle’s body. This formation shows a clear shift in sentiment where buyers overwhelm sellers, signalling a potential price rally.
Significance in Price Action: This pattern is powerful of its ability to catch reversals early. It often marks turning points where buyers gain dominance, making it a reliable trigger for initiating long trades. In volatile markets like Nigeria's equities, this can signal timely opportunities to capitalise on momentum.
Example from Nigerian Stock Market: In 2023, MTN Nigeria frequently showed bullish engulfing patterns during price corrections, signalling strong rebounds. Traders who acted on these patterns profited as prices moved upward on increased investor confidence post-correction.
How Piercing Line Signals a Bounce: The piercing line pattern appears during a downtrend when a bullish candle closes above the midpoint of the preceding bearish candle. This suggests buyers are stepping in forcefully, which often leads to a short-term price bounce.
Morning Star as a Strong Reversal: The morning star is a three-candle pattern marking strong bullish reversals. It begins with a bearish candle, followed by a small-bodied candle signalling indecision, and concludes with a bullish candle closing well into the prior bearish range. This shows buyers taking full control.
Practical Use Cases: Both patterns are valuable for traders who want to confirm a shift in trend direction before committing funds. For example, during ember months when trading volume rises, spotting a morning star pattern alongside increased local market activity often anticipates lasting upward moves.
Recognising these common bullish candlestick patterns offers traders actionable insights, enabling smarter decisions in both Nigerian and global markets. Combining these patterns with volume and macroeconomic indicators enhances probability and risk control.
Understanding bullish candlestick patterns in the Nigerian market requires an appreciation of local dynamics that shape price behaviours. These patterns offer insights into possible market direction but must be interpreted with Nigerian market peculiarities in mind, such as high volatility and seasonal trends common here. By tailoring pattern recognition to our equities and combining them with local indicators, traders can make smarter, grounded decisions.
The Nigerian stock market often experiences sudden price swings triggered by political news, foreign exchange shifts, or changes in government policy. Such volatility can cause bullish patterns to appear more frequently, but not all signal sustained price moves. For instance, a bullish engulfing pattern seen in a stock like Dangote Cement may sometimes reflect a short-term reaction to a Central Bank of Nigeria (CBN) policy announcement rather than a long-term uptrend. Traders should therefore watch for confirmation by volume or follow-through price action before acting.
Volatility also means that stop-loss levels need careful adjustment to avoid being taken out prematurely. In high volatility phases, patterns may produce false signals more often than usual, so combining candlestick analysis with other technical or fundamental cues becomes essential.
The last quarter of the year, also called ember months, often brings increased trading activity in Nigeria. This is due to companies releasing annual reports, investors adjusting portfolios ahead of the new year, and general market optimism around festive seasons. During these months, bullish candlestick patterns like the morning star can indicate stronger price reversals as buying interest picks up.
On the flip side, some sectors may slow down, affecting how patterns play out. For example, consumer goods stocks sometimes experience pullbacks after a strong ember months rally, making bullish signals in December less reliable. Recognising these seasonal nuances helps traders apply bullish patterns appropriately and avoid chasing weak rallies.
Volume is a powerful local indicator to confirm bullish candlestick signals in the Nigerian Exchange (NGX). A bullish pattern supported by rising volume signals genuine buying interest. For example, if a piercing line pattern forms in MTN Nigeria shares alongside a spike in traded volume, it suggests strong demand pushing prices higher.
Price levels also matter. Patterns near key support zones or round numbers (like ₦200 or ₦300 per share) carry more weight. Nigerian traders watch these psychological levels closely, and a bullish candle breaking above them often triggers further buying, validated by volume.
Macro events strongly impact pattern reliability. Changes in CBN policies, such as adjustments to monetary policy rates or foreign exchange restrictions, directly influence market sentiment and liquidity. A bullish candlestick pattern emerging amid hawkish CBN policy tightening may lose steam quickly if lenders tighten credit.
Conversely, when the CBN introduces incentives for banks or FX liberalisation, bullish patterns can signal real market optimism. Traders following Nigerian equities must keep abreast of these policy shifts and consider them alongside candlestick signals to avoid costly misreads.
Reading bullish candlestick patterns without considering Nigeria's unique market environment is like trying to drive blindfolded. Combining local volatility, seasonality, volume, price levels, and macro impact gives you the clear view needed for smarter trading.
In summary, recognising the local context behind bullish patterns improves your timing and confidence in the Nigerian market. This approach helps separate genuine buy signals from noise, making your trading decisions more effective and profitable.
Bullish candlestick patterns offer vital clues for traders looking to time their entries and exits more effectively. But relying solely on these patterns without blending them into a broader strategy can lead to missed opportunities or losses. Integrating bullish patterns into a well-planned approach helps traders confirm trends, manage risk, and maximise returns.
Moving averages smooth out price action and highlight the overall trend direction. When a bullish candlestick pattern appears near a rising 20-day or 50-day moving average, it often confirms sustained buying interest. For example, a bullish engulfing pattern forming just above the 50-day moving average on a NGX-listed stock like Dangote Cement may indicate a stronger likelihood of an upward rally.
The Relative Strength Index (RSI) gauges momentum and helps spot overbought or oversold levels. A bullish pattern paired with an RSI below 30 suggests the stock is recovering from oversold conditions, enhancing the reliability of the signal. Conversely, if RSI is above 70, bullish patterns require caution as the stock might be overbought and due for correction.
Support and resistance act as natural barriers in price movement. Bullish candlestick patterns that develop near established support levels tend to have greater validity. For instance, if a morning star pattern emerges at a major support zone on the NGX, it signals a potential trend reversal with buyers stepping in decisively.
On the flip side, bullish patterns emerging close to resistance levels need careful monitoring since the price may struggle to break higher. Traders often look for a breakout above resistance accompanied by bullish candlesticks to confirm sustained upward momentum.
Even the best bullish pattern can fail, making stop losses essential. Placing a stop loss below the low of the bullish candlestick pattern limits downside risk if the market moves against you. For example, after spotting a piercing line on MTN Nigeria’s chart, setting a stop loss just below the pattern’s low can protect your capital if the bounce loses steam.
This practice helps prevent small setbacks from turning into larger losses. In volatile Nigerian markets, especially during ember months with unpredictable swings, disciplined stops save traders from costly surprises.
Not all bullish patterns carry equal weight. Strong formations backed by high volume or confirmation from other indicators warrant bigger positions. Conversely, weaker signals or those near resistance zones call for smaller stakes.
Adjusting your position size based on the reliability of the bullish pattern is a smart way to balance risk and reward. For instance, you might allocate 5% of your portfolio to a confirmed morning star set up on a blue-chip NGX stock but limit exposure to 1-2% if the pattern appears in a less liquid or volatile stock.
Combining bullish candlestick patterns with other technical tools and solid risk management practices helps Nigerian traders make smarter, more confident decisions in dynamic market conditions.
Through this multi-layered approach, traders can reduce false signals, protect their capital, and enhance chances of profitable trades.
Understanding bullish candlestick patterns is one thing, but applying them effectively in your trading requires avoiding some common pitfalls. These mistakes can cost traders dearly, especially in the Nigerian market where volatility and external factors often add complexity. Let’s break down the key errors to watch out for.
Relying solely on bullish candlestick patterns without considering the broader market context is a frequent mistake. For example, seeing a hammer or bullish engulfing pattern during intense market downtrends or amid heavy macroeconomic uncertainty can easily mislead. In Nigeria, events like changes in Central Bank of Nigeria (CBN) monetary policy, fuel scarcity, or political developments often shift market sentiment suddenly.
Patterns don’t operate in a vacuum — a bullish signal during ember months could mean less than the same during a stable period. Traders should always analyse overarching trends, volume activity on the Nigerian Exchange Group (NGX), and news flow before taking a position. Without this, you might buy into a false hope, leading to losses.
Another trap is treating bullish candlestick patterns as standalone triggers. Some novice traders jump to buy once they spot a piercing line or morning star, neglecting confirmation from other technical tools. This often results in premature entries.
Confirm signals with tools like Relative Strength Index (RSI), Moving Averages, or support and resistance levels to validate the pattern’s strength. For instance, a bullish engulfing pattern near a long-term support zone in a stock like Dangote Cement could offer a better entry than the pattern alone. Confirmation helps filter out noise, providing a clearer trading signal.
Ignoring risk management around bullish patterns leaves traders vulnerable to unexpected reversals. No pattern guarantees success, so setting stop-loss orders to limit downside is vital. For example, if you enter a trade by spotting a morning star in a bank stock on the NGX, placing your stop-loss just below the recent swing low protects your capital.
Position sizing based on the reliability of the pattern and your overall portfolio risk tolerance also matters. Many fail by committing too much capital simply because a pattern looks promising, resulting in heavy losses when the trade turns against them. Remember, safeguarding your funds is as important as identifying profitable setups.
Successful trading blends pattern recognition with context awareness, logical confirmations, and disciplined risk management — especially in Nigeria’s dynamic market environment.
Avoid these common mistakes and you’ll make more informed, balanced decisions with bullish candlestick patterns, improving your chances for consistent gains.
📉 Learn how bearish candlestick patterns signal possible market dips. Get tips to spot, interpret, and use them smartly in trading decisions.

Explore a detailed guide on candlestick patterns 📈 for traders in Nigeria and beyond. Learn to spot, interpret, and apply these formations for smarter trades.

📊 Discover key candlestick patterns, understand trader sentiment, and access essential PDF guides to improve your stock market strategies effectively.

Master 35 key candlestick patterns 📊 to spot market trends in Nigeria 🇳🇬. Learn practical tips and get a handy PDF guide for fast reference!
Based on 14 reviews