

Understanding Forex Trading for Nigerian Traders
💱 Understand forex trading: how the global currency market works, key players, methods, risks & rewards for Nigerian traders. Make smarter moves with forex insights today!
Edited By
Harry Wilson
Chart crypto trading provides a practical way to navigate the complex world of cryptocurrency markets. For Nigerian traders, understanding charts is vital because it shows actual market behaviour rather than relying on hearsay or guesswork.
At its core, chart trading means analysing price movements visually through graphs that display historical and real-time data. These charts help traders identify trends, spot entry and exit points, and assess market sentiment.

Line charts: Simple graphs plotting closing prices over time. Good for beginners to identify overall direction but lack detailed info.
Bar charts: Show open, high, low, and close prices (OHLC) within a time frame, providing insight into price volatility.
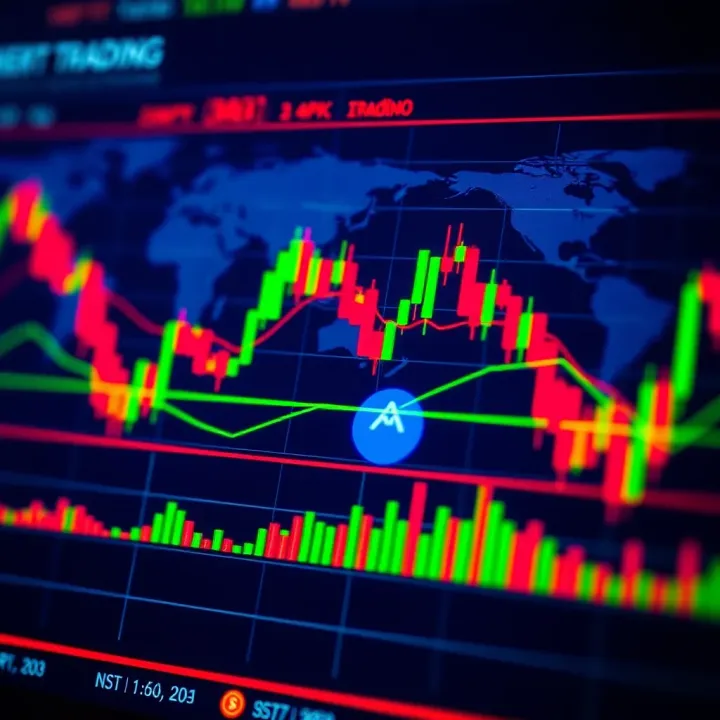
Candlestick charts: Popular among Nigerian traders because they display the same OHLC info but with coloured bodies and wicks that help interpret market psychology at a glance.
Candlestick patterns like "doji" or "hammer" give quick clues about possible reversals or continuation, making them practical tools for decision-making.
Besides chart types, key technical indicators such as Moving Averages (MA), Relative Strength Index (RSI), and Bollinger Bands help quantify market movements. For example, if Bitcoin’s RSI enters the overbought zone above 70, it could signal a correction ahead. On local platforms like Quidax or Binance Nigeria, combining these indicators with price action guides smarter trades.
Nigerian crypto traders face unique challenges, like naira volatility and platform liquidity constraints. Thus, interpreting charts cautiously is necessary. Also, understanding timeframes matters—a trend seen on a 1-hour chart might look different on a daily chart.
Start by practising with demo accounts or small amounts, focusing on learning to spot trends, support/resistance levels, and chart patterns relevant to popular coins such as Bitcoin (BTC), Ethereum (ETH), or Binance Coin (BNB).
Ultimately, chart crypto trading demands patience and discipline. Nigerian traders who grasp chart basics can make better trading calls and navigate volatile ₦ markets with more confidence.
Chart crypto trading is fundamental for anyone serious about navigating cryptocurrency markets with precision. It offers a way to visually track price changes and market behaviour, turning complex data into actionable insights. Nigerian traders especially benefit from understanding chart basics because of the market's volatility and frequent price swings influenced by local factors like naira fluctuations.
Charts allow traders to see the history of an asset’s price in one glance. For instance, Bitcoin’s price over a month can reveal clear upward or downward trends, peaks, and dips, helping you decide when to buy or sell. This visual approach is practical because price movements often follow patterns influenced by market sentiment, news, or broader economic events.
While fundamental analysis looks at underlying factors like project teams or crypto adoption rates, charts focus purely on price data. Many Nigerian traders find charts more immediate and tactical — for example, a chart can signal a quick trend reversal before fundamental factors catch up. Unlike news or sentiment, which can be slow to reflect in prices, charts respond instantly, giving traders a timely edge.
Charts equip traders with evidence to back their decisions rather than relying on guesswork. For example, seeing a strong support level repeatedly holding on an Ethereum chart can encourage a buy, while observing a breakdown below that level might signal caution. In volatile Nigerian markets, this makes chart reading a vital skill for managing risks and timing trades effectively.
Candlestick charts are the backbone of crypto trading. Each candle shows open, high, low, and close prices for a specific period, using colour to indicate price direction. For example, a green candle means prices rose; red means they fell. Nigerian traders like this format because it conveys detailed price action in a compact form, revealing patterns like "doji" or "hammer" which forecast possible reversals.
Line charts connect closing prices over time, offering a simplified view of price movement. They’re easy to read but lack detail such as intraday highs or lows. For beginners in Nigeria wanting a quick snapshot without overwhelming detail, line charts serve well. However, they do not show nuances needed to spot precise entry or exit points.
Bar charts resemble candlestick charts but with a different visual style. Each bar displays the open, high, low, and close, marked by ticks on the bar itself. These charts give traders more granular insight into price fluctuations without the colour coding, which some find less intuitive but more functional for advanced analysis. Nigerian traders who trade frequently or use signals appreciate this level of detail.
Mastering these basics is your first step to making smarter, more confident moves in Nigeria's crypto space. Without it, even the best strategies lack a strong foundation.
Technical indicators play a vital role in crypto chart trading, especially for Nigerian traders navigating volatile markets. These tools convert raw price and volume data into understandable signals, helping traders make better decisions and time entries or exits more effectively. While charts show price movements, indicators add context and depth to those patterns, making them indispensable in crypto trading.
Moving averages smooth out price data to highlight trends over specified periods. The Simple Moving Average (SMA) calculates the average price over a set number of days, treating each day equally. The Exponential Moving Average (EMA), on the other hand, weighs recent prices more heavily, making it more responsive to recent market changes. For a Nigerian trader, using the 50-day and 200-day EMAs together is common practice — a crossover of the shorter EMA above the longer one often signals a buying opportunity.
The RSI measures the speed and change of price movements to indicate overbought or oversold conditions on a scale of 0 to 100. When the RSI is above 70, the asset might be overbought, suggesting a possible pullback. Conversely, a reading below 30 indicates oversold conditions, hinting at a potential price rise. RSI helps Nigerian traders avoid entering at a peak or selling at a low, especially during periods of intense market swings.
MACD is a momentum indicator that tracks the relationship between two EMAs, usually the 12-day and 26-day. The MACD line crossing above the signal line (typically a 9-day EMA of the MACD) can be a bullish signal, while crossing below suggests bearish momentum. For crypto traders in Nigeria, MACD offers a timely alert on trend shifts, which can be crucial given market volatility affected by global crypto news or local regulatory shifts.
Sudden spikes in trading volume often signal strong interest or panic, coinciding with significant price moves. For instance, if Bitcoin's volume surges simultaneously with a price rise on a Nigerian exchange, it might confirm strong buying demand. Ignoring volume spikes risks missing details about the trade’s strength or weakness.
Sustained high volume during a price uptrend often supports a genuine rally, while declining volume can warn of an impending reversal. Nigerian traders should watch volume alongside price moves because low volume rallies may not last, especially on less liquid local crypto platforms. Volume indicators help separate true market moves from blips driven by few traders, increasing confidence in trading decisions.
Using a combination of technical indicators and volume analysis sharpens a trader’s edge, turning charts from pictures of price into actionable maps for profit.
The tools discussed here offer Nigerian traders clear ways to understand market action and improve timing. Mastery of these indicators enables smarter, data-driven crypto trading despite local market complexities like naira volatility and liquidity constraints.
Chart trading goes beyond just reading price movements; it requires strategies that help traders make calculated decisions. For Nigerian traders navigating the volatile crypto market and fluctuating naira, understanding effective trading strategies can improve timing and reduce losses. These strategies focus on recognising market trends, reversal signals, and key price levels to enter or exit trades smartly.
Identifying upward and downward trends starts with spotting consistent price movements over time. An upward trend shows prices making higher highs and higher lows, while a downward trend features lower highs and lower lows. For example, if bitcoin prices on Binance NG steadily increase from ₦18 million to ₦21 million over a week, that’s an upward trend signalling buying opportunities. On the flip side, a falling price pattern from ₦21 million to ₦17 million suggests a downward trend, hinting traders to consider selling or avoid buying.
Tracking these trends is vital because it tells traders whether to hold on or cut losses. Nigerian traders can combine trend observation with moving averages to smooth out erratic price actions common in crypto markets, especially local exchanges where liquidity is variable.
Spotting reversal signals helps traders anticipate when a trend might end and the price will move in the opposite direction. Common reversal signals include candlestick patterns like the hammer (a potential bullish reversal at a bottom) or the shooting star (possible bearish reversal at a peak). For instance, if Ethereum on Quidax shows a long lower wick hammer after a downtrend, it might signal buying interest returning.
Being alert to these signals can prevent sudden losses from price swings typical in Nigerian crypto trading. They give clues to exit losing positions or enter new trades before the market shifts sharply.
Drawing support and resistance zones involves identifying price levels where crypto assets repeatedly bounce off or struggle to cross. Support is a floor where demand increases, preventing price from falling further; resistance is a ceiling where supply grows, restricting upward movement. For example, if Ripple consistently rebounds around ₦250, that level serves as support. If it struggles past ₦300 several times, that’s resistance.
Recognising these zones helps Nigerian traders set entry and exit points clearly rather than guesswork. Support can guide buying decisions, while resistance helps decide when to take profits.
Trading breakouts and retracements requires action once prices cross these key levels. A breakout above resistance suggests strong buying momentum and a potential price surge. A retracement, on the other hand, is a temporary pullback to support after a breakout before continuing upward.
For instance, Bitcoin breaking past a ₦22 million resistance level on Luno Nigeria might prompt traders to buy, expecting further gains. But if the price pulls back to ₦21 million support (retracement), cautious traders might wait for confirmation of a bounce before re-entering.
Effective use of these strategies helps Nigerian crypto traders avoid common traps and make decisions based on price behaviour rather than emotions.
With sound trend analysis and support-resistance strategies, you can better navigate the unpredictable crypto markets, managing risks and seizing smart trading opportunities.
Chart trading in Nigeria comes with some unique challenges. Understanding these hurdles is key for traders who want to navigate the local crypto scene effectively. Nigerian traders deal with a volatile naira, liquidity issues on local platforms, and sometimes unreliable data sources—all of which can affect their ability to make sound decisions based on crypto charts.
The naira’s instability significantly impacts crypto prices for Nigerian traders. Since most cryptocurrencies are denominated in US dollars, sudden swings in the naira-dollar exchange rate can cause price distortions when converted back to naira. For example, if the naira weakens sharply against the dollar, a trader might see sudden price jumps in naira terms even if the crypto price in dollars remains steady. This fluctuating exchange rate adds an extra layer of complexity when reading charts and making trading decisions.
Liquidity poses another challenge on many Nigerian crypto exchanges. Unlike top global platforms, local exchanges such as BuyCoins or Quidax sometimes suffer from limited trading volumes. This low liquidity may cause wider spreads between buying and selling prices, making it harder to enter or exit positions at desired price points. Traders may notice price gaps or sudden spikes on charts that don’t reflect the broader market trend but the thin order book instead. This irregularity can mislead those who rely solely on chart patterns.
Nigerian traders often rely on platforms like Binance, LUNO, or local services such as Yellowcard for chart access. While Binance and LUNO provide fairly robust charting features, local platforms vary in chart quality and usability. Yellowcard, for instance, offers straightforward charts but lacks some advanced technical indicators traders might expect. Choosing the right platform depends on balancing ease of use, data accuracy, and available tools.
Data delays and reliability issues are another concern. Some Nigerian exchanges or wallet services experience lags in price updates or incomplete trade records due to limited technological infrastructure. Such delays affect real-time chart readings, which are crucial for day traders or scalpers. For example, during major price swings, a data lag can cause charts to show outdated prices, prompting wrong trading decisions. This challenge pushes many Nigerian traders to cross-reference multiple platforms or use global exchanges alongside local ones.
For Nigerian crypto traders, being aware of these challenges helps to avoid costly mistakes. It also underlines the importance of combining chart analysis with a good understanding of local market conditions and reliable data sources.
For Nigerian crypto traders, combining chart analysis with broader factors can improve decision-making. Chart patterns show price action but blending these signals with real-world developments prevents costly mistakes. Similarly, managing risks and having grounded expectations helps you protect your capital and avoid emotional trades. These tips aren't just common sense; in Nigeria's volatile market environment, they can significantly separate winners from those who lose naively.
Considering regulatory news and market sentiment
Regulatory announcements or government statements can move crypto prices sharply in Nigeria. For instance, rumours about the Central Bank of Nigeria (CBN) tightening crypto restrictions often lead to rapid sell-offs, regardless of what the charts suggest. Monitoring local news and social media sentiment helps traders anticipate these moves before they reflect in price charts.
Market sentiment also fuels momentum. When popular crypto influencers or platforms announce support or warnings, traders rush in or out, impacting volumes and price trends. Therefore, using chart analysis alongside active tracking of market buzz, news from bodies like SEC Nigeria, and even informal sentiment on platforms like Nairaland gives you a better edge.
Tracking CBN policies affecting crypto
CBN's policies directly affect crypto liquidity and valuation in Nigeria. For example, the bank's directive banning financial institutions from dealing with crypto exchanges in the past created liquidity shortages that no chart indicator could predict.
Stay updated on policy changes, forex restrictions, or naira devaluation decisions because these macro factors shape trading conditions daily. Even the monetary policy rate influences investor appetite for risky assets like crypto. Understanding these policies alongside chart signals allows for smarter entry and exit points, especially when naira fluctuations distort crypto prices.
Using stop-loss and take-profit orders
Stop-loss and take-profit orders are essential for protecting your investment and locking in gains. In Nigerian markets, where unexpected price swings are frequent due to illiquidity or speculative bursts, a well-placed stop-loss prevents you from losing more than you can afford.
For example, if you buy Bitcoin at ₦20 million and set a stop-loss at ₦19 million, your position automatically closes to avoid bigger losses if the price drops sharply. Similarly, a take-profit order can secure profits once the price hits a target, removing the stress of timing exits perfectly.
Avoiding overtrading based on charts alone
Chart signals can tempt you to trade very frequently, chasing every uptick or reversal. This overtrading commonly leads to high transaction costs and emotional exhaustion, especially on Nigerian platforms where fees and withdrawal limits can hurt your returns.
Instead, use charts as one tool within a solid trading plan. Combine them with fundamental cues and risk controls. For instance, instead of reacting to every candlestick pattern, focus on clear trends confirmed by volume and broader market news. Patience often wins in crypto trading here, rather than jumping at every signal.
Trading crypto charts in Nigeria demands practical awareness of local realities. Combine chart study with regulatory insight, set risk limits with stop orders, and resist overtrading to improve your chances of consistent success.
💱 Understand forex trading: how the global currency market works, key players, methods, risks & rewards for Nigerian traders. Make smarter moves with forex insights today!
🔍 Explore top crypto trading platforms in Nigeria! Compare features, fees, security, local payments & support to choose the best fit for you.
Explore the best crypto trading bots for Nigerian traders 🤖! Learn how they work, key benefits, risks, and setup tips tailored for the Nigerian market 🇳🇬.
Looking for the best crypto trading app in Nigeria? 📱 Discover top features, security tips 🔒, fees, user experience, and trusted options to trade safely.
Based on 8 reviews