

Key Chart Patterns Every Trader Should Know
📊 Discover 7 key chart patterns every trader should know for smarter market moves. Understand their traits, psychology, and get a handy PDF guide!
Edited By
Henry Mitchell
Chart patterns form the backbone for many traders and investors aiming to anticipate market movements. These patterns offer visual cues from price charts, reflecting the ongoing battle between buyers and sellers. Understanding these formations helps you predict potential shifts in market trends, enabling more strategic trading decisions.
In practice, chart patterns range from simple shapes like triangles and flags to complex formations such as head and shoulders or double tops. Each pattern signals different market sentiments—whether momentum is gaining strength, facing resistance, or preparing for reversals. For instance, a rising wedge pattern often warns of a price drop after a steady climb, while a cup and handle indicates a likely upward breakout.

Recognising these patterns early can improve timing and reduce risk, especially in volatile markets like the Nigerian Stock Exchange (NGX) or forex trading platforms.
Traders often complement these visual patterns with volume data to confirm the validity of signals. For example, an upward breakout from a rectangle pattern is more convincing if trading volume surges simultaneously. This practical detail helps avoid false signals that could lead to losses.
For Nigerian traders juggling between equities, forex, or cryptocurrencies, mastering chart patterns equips them to navigate diverse markets effectively. This is particularly valuable given the naira’s exchange rate fluctuations and local market dynamics.
PDF resources offer detailed visuals and explanations crucial for learners who want quick references outside live charts. These guides typically include annotated examples and pattern checklists, making it easier for you to practise chart reading regularly.
Help identify entry and exit points
Signal potential trend reversals or continuations
Improve risk management by setting stop-loss levels
Enhance confidence in trading decisions
Applying these chart patterns with discipline can sharpen your market analysis. Next, we will explore the most common formations, their meanings, and how to integrate PDF resources for hands-on learning.
Chart patterns form the backbone of technical analysis in trading. They help traders and investors identify potential price movements by recognising visual formations on price charts. In Nigerian markets, where price swings can be abrupt due to factors like naira volatility or political events, chart patterns provide a useful lens to anticipate possible market directions before news affects prices.
Understanding chart patterns matters because it allows you to react more confidently. For example, spotting a "head and shoulders" pattern early can signal a reversal, helping you exit a position before losses pile up. Conversely, recognising a "bullish flag" could prompt you to hold on or add to a winning trade.
At their core, chart patterns reflect the psychology of market participants. Price actions show the battle between buyers and sellers, expressed through highs, lows, and volume movements. Patterns like triangles or double tops are the footprints left by traders as they take profits, enter at bargain prices, or react to market rumours.
For instance, a symmetrical triangle shows indecision – neither bulls nor bears have control, but the contracting price range hints that a notable move is upcoming. This pattern does not predict the direction but signals that volatility will soon return.
Importantly, chart patterns are not magic but practical signals based on crowd behaviour. Recognising them helps you understand the market’s current mood and probable next steps, which is vital when trading stocks like Nigerian banks or commodities such as oil and cocoa.
Chart patterns guide your entry and exit points, risk management, and position sizing. When you identify a reliable pattern, it can serve as a trigger for placing trades with predefined stop-loss and take-profit levels.
Consider the "double bottom" pattern: it often marks a strong support level where prices reverse after a downtrend. Entering a long position near this point allows for reasonable risk because you can place a stop-loss just below the recent low. Similarly, a "descending triangle" breaking downwards might encourage short selling with tight stop-loss settings.
That said, charts should not be analysed in isolation. Combining patterns with indicators like RSI or volume confirms the signal's strength. For example, a bullish breakout from a flag pattern backed by increasing volume is more trustworthy.
Recognising chart patterns sharpens your trading decisions by offering concrete signals amid the noise of the market. With practice, these visual cues become a second sense for when to act or hold back.
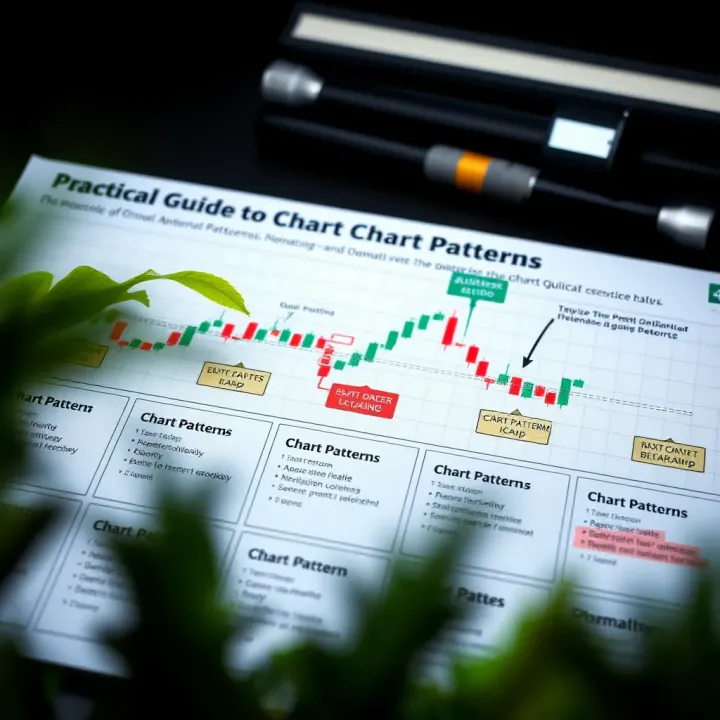
Understanding chart patterns equips you with practical knowledge to navigate Nigeria’s sometimes erratic markets with more precision. This introduction lays the foundation for exploring specific patterns and how you can apply them effectively in your trading strategy.
Recognising common chart patterns is essential for traders and investors aiming to make informed decisions in the Nigerian market. These patterns give clues about possible price direction, helping you anticipate market moves rather than react blindly. Understanding both reversal and continuation patterns allows you to spot when a trend might end or resume, which can improve timing your trades or investments.
The Head and Shoulders pattern is a classic reversal signal indicating a potential change from an uptrend to a downtrend. It consists of three peaks: a central, higher peak called the "head" flanked by two shorter peaks termed "shoulders." This formation suggests the momentum is fading, and sellers are gaining strength. For instance, if a Nigerian equities chart shows this pattern after a long rally, it could mean the price will drop soon, signalling traders to consider selling or tightening stop-losses.
Double Top and Double Bottom patterns mark strong resistance or support levels hit twice, signalling a possible reversal. A Double Top appears after an upward trend forms two high points at similar levels before dropping. Conversely, a Double Bottom forms following a downtrend when the price tests a support level twice before bouncing back up. For example, if a USD/NGN forex chart forms a Double Bottom, it could indicate the naira's recent weakness might reverse, offering a chance to enter long positions.
Similar to double formations but with an extra test of price levels, Triple Top and Triple Bottom patterns give even stronger reversal signals. They show that the price struggled multiple times to break a key level but eventually succumbs to a change in direction. Traders relying on Nigerian stock data might use this pattern to confirm the exhaustion of a trend before deciding to buy or sell, reducing the risk of false signals that sometimes come with double tops or bottoms.
Triangles signal pauses before the existing trend continues. A symmetrical triangle features converging trend lines—balance between buyers and sellers—that resolves when price breaks out in the direction of the preceding trend. Ascending triangles suggest stronger buying pressure and often lead to upward moves, while descending triangles hint at selling dominance and potential declines. For example, a symmetrical triangle on a Nigerian oil sector share could mean investors are just waiting to confirm direction before pushing prices further.
Flags and pennants are short-term continuation patterns that look like small rectangles or tiny triangles, respectively. They appear after sharp price moves and represent brief consolidation or rest periods. Once the pause ends, prices usually surge in the prior trend’s direction. Nigerian forex traders often spot flags in pairs currency charts like NGN/USD when markets halt due to local economic announcements, then continue strongly.
Rectangles form when price moves sideways between parallel support and resistance levels, indicating indecision. This pattern often confirms that once the resistance or support breaks, the trend will resume with strength. In the local context, a rectangle in the share price of a major bank during an election period might show traders waiting for political clarity before pushing prices further.
Knowing these pattern types helps you spot not just when to enter or exit trades but also manage risks better in Nigeria's dynamic markets.
Understanding Common Types of Chart Patterns is a fundamental skill you can sharpen using reliable PDF resources filled with diagrams and practical examples. This will prepare you to trade smarter, not harder, especially in a market that can be as volatile as ours.
Chart pattern PDFs serve as valuable tools for traders, investors, and analysts wanting to deepen their understanding of market movements. Rather than relying on fleeting online articles or random screenshots, PDFs offer a structured, easy-to-reference format that can be accessed offline anytime. For Nigerian traders juggling power outages and limited internet, having a downloadable, well-organised guide becomes even more practical.
PDF guides on chart patterns typically contain clear visuals, detailed explanations, and real-world examples to aid learning. You can expect to find step-by-step breakdowns of popular patterns like the Head and Shoulders, Triangles, Flags, and Double Tops/Bottoms. A good PDF will include annotated charts highlighting key points such as breakout zones and volume changes. This visual clarity helps traders recognise patterns faster during live trading sessions.
Besides diagrams, you’ll often see tips on how to confirm patterns using technical indicators like RSI or volume trends. Some PDFs also share historical case studies from global markets and even Nigerian stock exchanges to put concepts in local context. The presence of practice exercises or quick quizzes can enhance retention.
Not all chart pattern PDFs deliver quality content. Start by checking the author’s credibility—traders with proven track records, financial educators, or recognised institutions provide more trustworthy material. Avoid PDFs packed with generic jargon and vague statements; the best resources explain concepts concretely and include real chart snapshots.
Also, evaluate the publication date. Markets evolve with new tools and trends, so recent versions tend to be more relevant. Forums like Nairaland or platforms like Investopedia can suggest highly-rated PDFs used by seasoned Nigerian traders. Lastly, PDFs linked to well-known trading apps or local brokerages usually have practical relevance.
To truly benefit, treat the PDF as a living document, not just a one-time read. Mark important sections, add notes, and periodically revisit tricky patterns to reinforce understanding. Use the charts in the PDF to compare with live trading charts on platforms such as MTN’s SmartTrade or GTBank’s investment portal.
Pair your study with active trading practice, even if with small capital. Applying pattern recognition in real-time cements knowledge better than theory alone. Where possible, discuss your observations with fellow traders or online communities to broaden perspective.
A well-chosen chart pattern PDF can be your pocket mentor—consult it regularly to sharpen your market insights and improve trading confidence.
In sum, investing time in quality PDF resources equips you with a handy reference that complements fast-moving market analyses and teaches pattern recognition in a clear, accessible way. This systematic approach aids not just beginners but also experienced players looking to polish their strategy for the Nigerian markets.
Chart patterns become truly valuable when you apply them effectively in your trading strategy. Recognising these patterns helps forecast market movements, but integrating them into a broader plan can improve trade accuracy and profitability. For example, spotting a head and shoulders pattern may signal a trend reversal, but combining this insight with volume analysis or moving averages can confirm the move before you place your trade.
Using chart patterns alone can invite false signals. That is why combining them with other market indicators makes your analysis more robust. For instance, if you identify a bullish flag pattern on the Nigerian Stock Exchange (NGX), confirming it with the Relative Strength Index (RSI) can indicate whether the stock is oversold and ready for a breakout. Similarly, pairing chart patterns with moving averages helps filter noise; a breakout above a 50-day moving average supports the idea of an upward trend continuation.
Traders also use the Moving Average Convergence Divergence (MACD) alongside patterns to detect momentum changes. When the MACD crosses above its signal line near a support-level chart pattern, it adds extra weight to the buy decision. Combining these tools reduces reliance on guesswork and fosters confidence in your trades.
No trading strategy is complete without risk management, especially when operating on chart patterns susceptible to false breakouts. Setting stop-loss orders just outside pattern boundaries helps limit potential losses. For example, if trading a double bottom pattern on a bank stock, place a stop-loss a few naira below the lowest trough to protect your capital in case the pattern fails.
Besides, position sizing is crucial. Never risk more than a small percentage of your trading capital on one trade because market unpredictability remains high. Also, be mindful of external factors like market news, liquidity, and economic data releases — these can disrupt chart patterns unexpectedly. Practising patience and avoiding overtrading during volatile periods can save you significant losses.
Risk management and combining indicators are not just best practices—they're the pillars that turn chart pattern recognition from an educated guess into a strategic edge.
Consider a popular Nigerian consumer goods stock showing a descending triangle on its price chart. A trader spots this and waits for confirmation—a break below the support line with rising volume. Combining this with a bearish MACD crossover, the trader enters a sell position, expecting a downward trend.
On the flip side, a blue-chip bank stock forms a bullish double bottom after an extended dip. Confirming with RSI below 30 indicates oversold conditions. The trader buys, setting a stop-loss below the pattern's low point. Over the next weeks, the stock rallies, illustrating how using patterns with indicators and disciplined risk control can yield profits.
Such examples reflect how traders in Nigeria’s dynamic market use chart patterns practically rather than theoretically. Patterns alone may hint at possibilities, but strategic application turns those possibilities into thoughtful decisions with better chances of success.
📊 Discover 7 key chart patterns every trader should know for smarter market moves. Understand their traits, psychology, and get a handy PDF guide!

Explore binary operators in programming and maths 🖥️, from types to uses, with clear examples for efficient coding and debugging in various languages.

📊 Learn how to convert numbers between binary and decimal easily! This guide covers practical methods and real-life uses of binary in tech and computing. 💻

Explore a detailed guide on candlestick patterns 📈 for traders in Nigeria and beyond. Learn to spot, interpret, and apply these formations for smarter trades.
Based on 14 reviews