
Choosing the Best Forex Indicator for Nigerian Traders
📈 Explore key forex indicators popular among Nigerian traders, learn their pros and cons, and get tips to use them effectively for better trading decisions.
Edited By
Charlotte Green
Candlestick patterns form a vital part of forex trading strategy, especially for those serious about navigating Nigeria’s dynamic currency markets. These patterns help traders identify potential price moves by visually summarising market sentiment within a given time frame.
Unlike just numbers or line charts, candlestick patterns give a richer snapshot of price action by showing the open, close, high, and low prices in each period. This info can help you anticipate whether the market is likely to reverse or continue in its current direction.
They offer a clear, easy way to read market behaviour in real-time.
They reflect the tug-of-war between buyers and sellers, which is critical in volatile markets like the Nigerian forex space.
They can signal entry and exit points, helping traders optimise profit and control risk.
For example, a ‘hammer’ candlestick, seen after a downtrend, might suggest that selling pressure is fading and buyers are gaining ground. This could be the start of a price bounce, offering a chance to buy before the market edges up.
Understanding these patterns in the context of Nigeria’s market conditions — such as naira volatility, CBN interventions, and external shocks — can greatly improve your trading decisions.
Mastering candlestick patterns is not just about recognising shapes but also about interpreting their location in the chart and combining them with other tools like support and resistance or volume analysis. This combined approach sharpens your ability to predict real price movements rather than relying solely on guesswork.
As you read on, you’ll find straightforward breakdowns of key patterns and practical tips to apply them for smarter trading in Nigeria’s forex environment. Whether you trade on platforms like MT4, MT5, or local brokers connected to the NSE currency markets, these patterns can enhance your market reading skills effectively.
Understanding the basics of forex candlestick charts is essential for anyone serious about trading. These charts offer a clear and concise way to visualise price movements within a specific timeframe. Unlike simple line charts, candlesticks provide detailed information that helps traders spot trends, reversals, and market sentiment. For example, in Nigeria's volatile market, where naira pairs may swing sharply within hours due to news or Central Bank interventions, candlestick charts can highlight key moments when the market sentiment shifts.
A candlestick represents price activity within a set period—this could be one minute, one hour, or a full day. Each candlestick contains vital data points: the opening price, closing price, highest price, and lowest price during that interval. Visual learners benefit from this format as it paints a picture of price behaviour in a compact, easy-to-grasp form. Imagine a trader looking to enter the USD/NGN pair; candlesticks will reveal moments when buyers or sellers dominated, aiding better timing for entries or exits.
The body of the candlestick illustrates the range between the opening and closing prices. A long body suggests strong buying or selling pressure, while a short body indicates indecision or little price movement. For instance, if a candlestick has a long green (or white) body, it usually means buyers pushed prices higher significantly during that period. Conversely, a long red (or black) body signals sellers controlled the market.
Wicks, or shadows, are the thin lines above and below the body. They mark the highest and lowest prices reached in the set timeframe. Long wicks show market volatility and price rejection at certain levels. For example, a long upper wick indicates sellers pushed back after a price spike, possibly signalling resistance. Nigerians trading local pairs like NGN/USD, especially during times of forex scarcity, can notice these wicks to sense fake breakouts and avoid traps.
Opening and closing prices determine the body’s start and end points. The relationship between these helps identify market sentiment for that period. If the close is higher than the open, bulls have the upper hand, meaning a potential bullish trend. If the close is lower, bears dominated. Traders use this information alongside volume and other indicators to validate signals. For example, on days when the CBN adjusts monetary policy, watching how candlesticks close relative to their open can assist traders in deciding whether to ride the trend or stay cautious.
Reading candlestick charts involves gauging patterns formed by consecutive candlesticks and understanding the story they tell about market psychology. Start by observing the size and colour of bodies, then study the wicks for signs of rejection or confirmation of trends. Combine this with knowledge of support and resistance levels for better accuracy.
Candlestick charts don't just show price; they reveal trader battle lines every minute, hour, or day. Knowing how to read them transforms raw numbers into actionable insight.
For Nigerian traders, this means you can identify when to buy or sell naira pairs effectively, avoid false signals commonly occurring during ember months when markets get choppy, and align your strategy with Nigeria’s unique trading environment. Mastery of the basics here sets the foundation for smarter, more profitable trading.
Single candlestick patterns serve as the foundation for understanding price action in forex trading. These patterns provide immediate visual clues about market sentiment—whether buyers or sellers hold sway. Recognising them can help traders make quicker decisions on entry, exit, or holding positions without waiting for multiple candles to form complex patterns.
The Doji is a key pattern signalling indecision between buyers and sellers. It forms when the opening and closing prices are nearly identical, producing a candle with a very small body. This pattern often appears during periods of consolidation or at potential turning points in the market. For example, if a Doji appears after a strong uptrend on the USD/NGN pair, it signals traders to pay attention as the market may be hesitant to push prices higher. The Doji doesn't predict direction on its own but alerts traders to pause and watch for confirmation from subsequent candles or indicators.
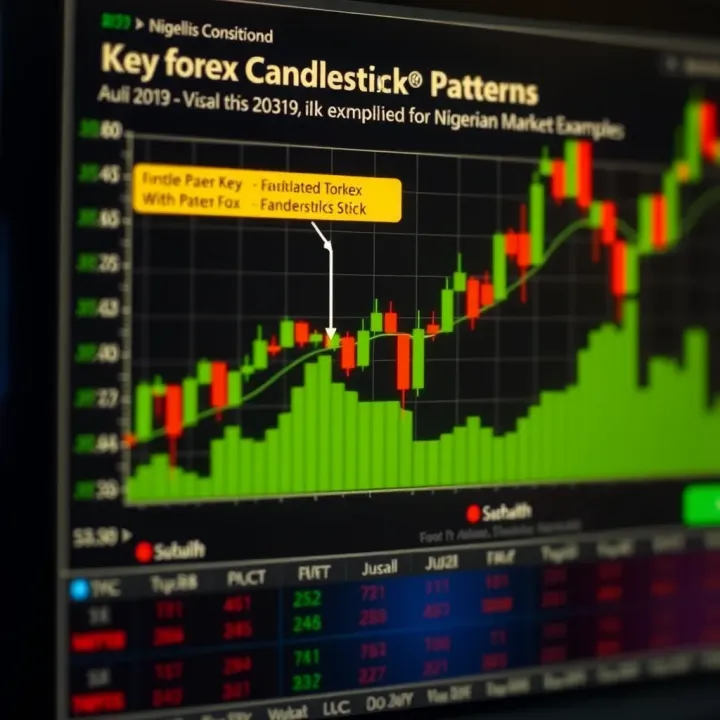
Both Hammer and Hanging Man candlesticks feature small bodies and long lower wicks, showing rejection of lower prices. The main difference lies in their location on the chart. The Hammer shows up after a downtrend, signalling a possible bullish reversal as buyers start pushing prices back up. The Hanging Man appears after an uptrend, hinting at a potential bearish reversal because sellers managed to drive prices down significantly before buyers regained control.
When traders spot a Hammer after a persistent decline on, say, the EUR/USD chart, it often suggests buyers are entering the market and the downtrend might soon reverse. However, it's wise to wait for a confirming candle that closes higher before acting. Conversely, a Hanging Man formed after a clear uptrend warns traders that selling pressure could increase, leading to a downturn. Confirmations like a lower close on the next candle or a drop in volume strengthen this bearish signal. Nigerian traders should combine these insights with local market factors, such as geopolitical events or CBN policy changes, before making decisions.
The Shooting Star and Inverted Hammer share a similar shape—small bodies with long upper shadows—but convey different messages depending on context. The Shooting Star appears at the top of an uptrend, signalling a possible reversal as buyers push prices up but sellers force them back down during the session. On the other hand, the Inverted Hammer forms after a downtrend, suggesting buyers are trying to turn the momentum around despite initial selling pressure.
Both patterns call for confirmation from following candles or volume changes before traders act. For instance, if the NGN experiences a Shooting Star against the USD and is followed by a bearish candle, it could indicate impending weakness in the naira, guiding traders to reconsider their positions.
Recognising and correctly interpreting single candlestick patterns like Doji, Hammer, and Shooting Star helps forex traders anticipate shifts in market momentum. However, patience for confirmation is always crucial to avoid premature decisions based on incomplete signals.
This understanding equips Nigerian traders with practical tools to respond swiftly in volatile forex conditions while managing risk effectively.
Multiple candlestick patterns give traders more reliable signals compared to single candlesticks since they reflect a sequence of price actions. In the forex market, these patterns reveal potential shifts in momentum or trend direction. When you spot them, especially combined with other technical tools, they can improve your timing for entering or exiting trades.
An engulfing pattern involves two candles where the second candle completely covers or “engulfs” the body of the previous one. For a bullish engulfing, a smaller bearish candle is followed by a larger bullish candle. This suggests strong buying pressure, potentially signalling the end of a downtrend and a shift to rising prices. Consider GBP/USD trading: if after a downtrend you notice a bullish engulfing near support, this could be a cue to open long positions.
A bearish engulfing pattern flips this logic. After an uptrend, a small bullish candle is followed by a large bearish candle engulfing it, indicating sellers are gaining control. For example, EUR/USD showing a bearish engulfing near resistance might warn traders to exit long positions or prepare for shorting.
It is key to watch volume or confirmation from other indicators like RSI to rule out false alarms. This pattern’s strength grows when it appears near significant support or resistance levels.
The harami pattern involves a large candlestick followed by a smaller candle contained within the previous candle’s body—imagine a mama put buying a smaller portion next to a larger plate of jollof. A bullish harami appears after a downtrend, where a large bearish candle is followed by a smaller bullish candle. This signals hesitation among sellers and a possible end to the decline.
Conversely, a bearish harami forms when a large bullish candle is followed by a smaller bearish candle, often pointing to a weakening uptrend.
Though not always as strong as engulfing patterns, haramis are useful for spotting pauses and potential reversals especially when coupled with indicators like moving averages.
The morning star and evening star are three-candlestick patterns signalling strong reversals. The morning star appears after a downtrend: a tall bearish candle, then a small-bodied candle (showing indecision), followed by a tall bullish candle closing well into the first candle’s body. This pattern tells you bears are losing grip and bulls are taking over.
The evening star is the mirror, occurring after an uptrend: a large bullish candle, small indecisive candle, then a large bearish candle confirming a reversal.
For Nigerian traders dealing with NGN/USD or NGN/EUR pairs, detecting these patterns around key economic releases or monetary policy announcements can be especially valuable.
Remember, no candlestick pattern works like magic. Always combine them with support and resistance levels, volume trends, or momentum indicators to improve trade accuracy.
By understanding these common multiple candlestick patterns, you equip yourself with tools to read market sentiment better and make smarter trading decisions in the forex market.
Applying candlestick patterns effectively can sharpen your forex trading by providing clearer signals on when to enter or exit trades. These patterns are not stand-alone tools; integrating them into your broader strategy helps avoid the pitfalls of false signals common in volatile markets like Nigeria’s.
Candlestick patterns gain strength when confirmed by volume and other technical indicators. For example, spotting a bullish engulfing pattern on the USD/NGN pair is more reliable if trading volume spikes simultaneously, signalling genuine buying pressure. Volume acts like a sanity check, helping differentiate between strong reversals and mere price fluctuations.
Moreover, indicators like the Relative Strength Index (RSI) or Moving Average Convergence Divergence (MACD) add depth. If an RSI shows oversold conditions alongside a hammer candlestick, it suggests an increased chance of price reversal. Using these indicators in tandem reduces guesswork and improves decision accuracy.
Candlestick patterns guide entry and exit points with more precision. Consider the morning star pattern appearing on the GBP/USD chart. This signals a potential trend reversal from bearish to bullish, making it an attractive point to enter a long position. Likewise, an evening star near a resistance level can help you decide to exit before a price drop.
A practical approach is to combine candlestick signals with support and resistance levels. For instance, a bullish engulfing pattern forming at a support zone on the EUR/USD may be a solid entry trigger. Conversely, spotting a shooting star at resistance reinforces cautious profit-taking or stop-loss placement.
Risk management remains vital when trading with candlestick patterns. Always pair your trade setups with stop-loss orders to cap potential losses if the market moves against you. For example, if a bearish engulfing candle forms but price breaks above the pattern’s high, your stop-loss limits unnecessary loss.
Also, avoid over-reliance on a single pattern. Context matters—a bullish hammer in a strong downtrend might not always signal a reversal without broader confirmation. Use proper position sizing based on your account balance and volatility of the currency pair—especially important in Nigerian markets, where naira exchange rates can be unpredictable.
Successful forex trading isn’t about finding perfect patterns but about combining them wisely with volume, indicators, and sound risk control to improve your odds.
Integrating candlestick analysis into your forex strategy is a practical way to trade smarter. By confirming patterns through volume and indicators, timing your entries and exits carefully, and maintaining disciplined risk management, you increase your chance of consistent profits in Nigeria’s forex market.
Candlestick patterns are a powerful tool for forex traders, but they are far from foolproof. Understanding their challenges and limitations is crucial to avoid costly mistakes in trading. Often, traders in Nigeria and elsewhere might place too much trust in these patterns without considering broader market dynamics, leading to misguided decisions.
One major challenge is the frequent occurrence of false signals. These happen when a candlestick pattern suggests a price move or reversal, but the market moves in the opposite direction shortly after. For instance, a bullish engulfing pattern might form during low liquidity periods—like mid-afternoon in the Nigerian forex market—only for the price to stall or drop later. Market noise from sudden news, unexpected economic data releases, or erratic price spikes often confuses these signals.
Traders should remember that no pattern works 100% of the time. An example is during the ember months when market volatility tends to spike due to increased local and global economic activities plus holiday trading. In such times, interpreting candlestick signals requires extra caution. Using additional filters like volume confirmation, moving averages, or momentum indicators can help weed out false signals.
Candlestick patterns don’t exist in isolation. Their significance depends largely on the context—such as the prevailing trend, economic environment, and market sentiment. For example, a hammer pattern appearing in a strong downtrend on the USD/NGN pair might suggest a reversal, but if Nigeria announces a sudden change in monetary policy affecting the naira, that broader context can override the pattern.
Similarly, some patterns perform better in trending markets, while others might work poorly during sideways or volatile conditions. Recognising market phases like consolidation or breakout is essential before acting on candlestick signals. Nigerian traders, especially those working with local brokers or trading NGN-based pairs, should factor in local developments such as CBN interventions, fuel subsidy changes, or political events which greatly influence market reactions beyond technical patterns.
A candlestick pattern is a clue, not a crystal ball. Understanding the bigger picture and validating signals with other tools and news can prevent costly errors.
In practice, combining candlestick analysis with a broader view of fundamental factors and solid risk management helps Nigerian forex traders make smarter, more confident trades. Recognising the limitations of candlestick patterns avoids the trap of over-relying on them and facing unpleasant surprises in fast-moving markets.
Applying forex candlestick patterns effectively requires adapting your approach to Nigeria's unique trading environment. Local factors such as naira exchange rate volatility, broker offerings, and market liquidity influence how patterns perform. Understanding these realities sharpens your edge and helps avoid common pitfalls.
Many Nigerian traders focus on the NGN/USD pair and other naira-linked currency pairs. These pairs can behave differently from global majors due to Nigeria's monetary policy, forex restrictions, and occasional volatility spikes. For example, sudden CBN interventions to stabilise the naira may trigger erratic price movements, causing classic patterns like engulfing or harami to fail or mislead if taken alone.
Local brokers may offer smaller lot sizes and different spreads compared to international platforms. It's important to test your candlestick strategies on demo accounts with these brokers before committing real funds. Some brokers also lack detailed charting tools or robust data feeds for NGN pairs, affecting pattern accuracy. Regularly updating to brokers who support platforms like MetaTrader 4/5 or TradingView helps maintain clear candlestick visuals and reliable price data.
Nigerian forex markets often react to economic news, fuel subsidy changes, political events, and global commodity price shifts like crude oil. These factors create noise or sudden price jumps that can invalidate candlestick signals temporarily.
Pairing candlestick analysis with knowledge of such local events improves your trade timing. For example, if a bullish hammer appears just as the Central Bank announces a new forex policy easing, this might confirm a potential uptrend. Conversely, during ember months when market liquidity often thins and volatility rises, candlestick patterns can produce false signals more frequently. Incorporate volume indicators and economic calendars regularly to sift noise from genuine signals.
Several platforms serve Nigerian traders well in mastering candlestick patterns. MetaTrader 4/5 remains popular due to wide broker support, free charting tools, and custom indicators. TradingView offers advanced charting with a social component where local traders share ideas.
Local financial news portals such as Nairametrics and BusinessDay provide timely economic updates that, combined with candlestick reading, enhance trading decisions. Mobile apps like OPay and PalmPay, while payment-focused, also link to fintech platforms allowing simple forex account funding.
Additionally, resources like Udemy and Coursera provide forex trading courses tailored for Nigerian contexts. Joining online trading communities or forums specifically for Nigerian traders helps share insights on candlestick performance in local conditions.
In forex trading within Nigeria, successful use of candlestick patterns hinges not just on pattern recognition, but also on syncing analysis with local market realities and reliable tools.
By adapting to NGN-specific dynamics, pairing technical signals with local economic events, and utilising suitable platforms, Nigerian traders can make candlestick patterns truly work for smarter decision-making.
📈 Explore key forex indicators popular among Nigerian traders, learn their pros and cons, and get tips to use them effectively for better trading decisions.
📈 Forex trading in Nigeria promises quick gains, but risks and strategies matter. Understand market conditions and realistic outcomes before risking your ₦ to trade smart.
Discover how forex trading works, key risks, and practical steps for Nigerian traders to profit from currency exchange rates in the dynamic ₦ market 🌍💱

📚 Master forex trading with top books tailored for Nigerian traders. Learn strategies, risk management, and how to navigate Nigeria's forex market for profitable trades. ₦
Based on 14 reviews