
Understanding Forex Trading for Nigerian Traders
Learn forex trading basics, strategies, risks, and best platforms tailored for Nigerian traders. Gain practical tips to trade confidently and securely 📈💱🇳🇬
Edited By
Ethan Reed
Forex trading charts show how currency prices move over time. For Nigerian traders, understanding these charts means making better decisions when buying or selling currencies—whether naira against the dollar or other major pairs like EUR/USD.
At its core, a forex chart is a visual tool that displays price data on a timeline. It helps traders track trends, spot reversals, and identify entry or exit points. Without reading charts properly, it’s like driving a danfo in Lagos traffic without knowing the route—you're going nowhere fast.
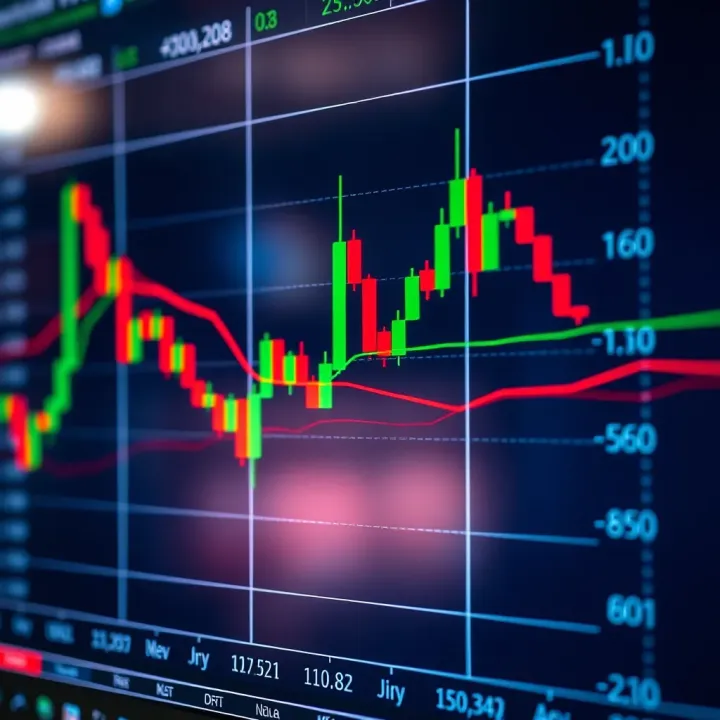
Charts come in various types, but they all share basic elements, such as price levels, timeframes, and volume indicators. Nigerian traders often start with the popular ones like line charts, bar charts, and candlestick charts, each offering unique insights. For example, candlestick charts reveal price action clearly by showing the open, close, high, and low within a selected timeframe.
A well-read forex chart is like having eyes on the market's heartbeat. It’s not just numbers; it’s what drives profitable trades.
Using these charts, one can apply technical indicators like Moving Averages (MA), Relative Strength Index (RSI), or Bollinger Bands. These tools assist in filtering market noise and understanding momentum, helping with risk management in a volatile market affected daily by naira fluctuations, Central Bank of Nigeria policies, and global economic updates.
In Nigeria's market context, the timing of trades can be quite strategic—especially around bank operating hours, important economic reports, or during ember months when market volatility tends to spike. Mastery of charts enables traders to anticipate such moves, potentially profiting from price swings.
Throughout this article, we'll break down how forex trading charts work, highlighting practical uses and examples tailored to Nigerians. The goal is to equip you with the tools to read and interpret price movements confidently, giving you a solid edge in the forex market.
Forex trading charts show the price movements of currency pairs over time, providing a visual snapshot of market behaviour. For Nigerian traders, these charts are indispensable tools because they help make sense of how the naira trades against other currencies, especially the US dollar and euro. By understanding what these charts represent, traders can spot trends, assess volatility, and identify potential entry or exit points.
Every forex chart has two axes: the price axis and the time axis. The price axis runs vertically, showing various price levels at which the currency pair has traded. For Nigerian traders watching the USD/NGN pair, this axis will display values like ₦410, ₦415, ₦420, reflecting how the price changes. The horizontal time axis marks the progression of time, ranging from minutes to months depending on the chosen timeframe. Connecting price with time allows traders to track how rates fluctuate throughout the day or over longer periods.
Candlestick charts are one of the most popular Chart types because they represent price action in a clear, meaningful way. Each candlestick shows four key price points within the given period: open, close, high, and low. For example, a bullish candle indicating a rise in USD/NGN might be green or white, signalling a strong buy momentum. Nigerian traders often rely on candlestick patterns to gauge market psychology, such as pin bars or engulfing formations, which hint at potential reversals or continuations.
Volume indicates how many units of the currency pair have been traded during a specific period. While forex volume tracking differs from equities, most platforms provide tick volume as an approximation. Higher volume often confirms the strength of a price move. Nigerian traders watching heavy volume spikes around major announcements, like CBN monetary policy changes, can better understand if a price move has solid backing or is likely to fizzle out.
Price fluctuations are the heart of forex charts. They result from changes in supply and demand, influenced by factors such as political events, economic data releases, or global market sentiment. For instance, if the naira suddenly weakens due to drop in oil prices, this will cause visible spikes and dips on the USD/NGN chart. Nigerian traders keep close eyes on these fluctuations to time their trades well.
The highs, lows, opens, and closes captured in each candlestick tell a story about market strength and trader sentiment. A high price shows the peak level reached; a low pinpoints the weakest point for that period. The opening price shows where trading started and the closing price indicates where it ended. For example, a candlestick with a high close and low open usually suggests buyers pushed prices up – a bullish sign. These values help Nigerian traders decide whether momentum favours buying or selling.
Charts are also a way to visually read emotions and expectations of market participants. Uptrends with solid green candlesticks reflect optimism, while long wicks or shadows might indicate indecision or rejection of price levels. Nigerian traders learn to interpret these subtle clues within the price action to anticipate changes ahead of time, rather than just react to numbers.
Successful forex trading in Nigeria depends on understanding these basic elements on charts. Grasping how price and time interact, recognising candlestick signals, and appreciating volume context helps traders stay grounded when markets get wild.
Forex trading charts offer different views of price data and appeal to various trading styles. Choosing the right chart type helps Nigerian traders spot trends, confirm market moves, and make timely decisions. Each chart visualises price action uniquely, providing insights tailored to beginners or more experienced traders.
Line charts connect closing prices over a specific period, showing a simple, clean trend. For starters, this clarity helps avoid confusion from too many details. Imagine watching the Nigerian Naira versus the US Dollar over a week—the line chart highlights whether the naira is generally strengthening or weakening without clutter.
Such simplicity is practical when you want to focus on overall direction rather than daily volatility. Line charts are ideal when you need to quickly assess market direction before diving deeper.
Line charts work well for long-term traders or those new to forex who prefer straightforward visual guides. When analysing broad trends or supporting other analytical tools, line charts provide a foundation. For example, a swing trader watching NGN/USD movement could use a line chart to confirm a general upward trend before considering entry points.
However, line charts are less useful when you need detailed price information, such as intraday highs and lows.
Bar charts add depth by displaying the open, high, low, and close (OHLC) for each time unit. Each vertical bar shows price range, while horizontal ticks mark opening (left) and closing (right) prices. This detail gives a fuller picture of market activity, important during volatile periods.
Take a busy trading day for Nigerian naira pairs: a bar chart reveals whether prices bounced back after dips or closed higher despite early falls, helping traders read the battle between bulls and bears more accurately.
Bar charts offer more precision than line charts, allowing traders to see market momentum and possible turning points. For instance, knowing the day's low and high can signal if a reversal or breakout is likely. This insight helps spot entry and exit points closer to the actual price action, which line charts might miss.
For day traders or scalpers in Lagos who track every naira movement, bar charts provide fresh angles.
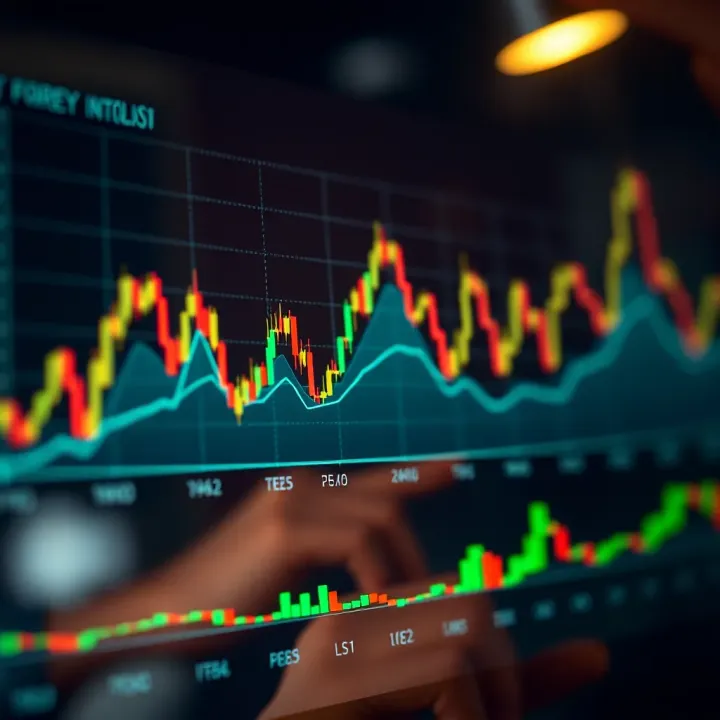
Candlestick charts display price action as candles with bodies and wicks, where body colour shows direction—often green or white for gains, red or black for losses. These shapes tell stories of supply and demand.
Interpreting candle sizes and shadows reveals traders’ emotions like fear or confidence. A long lower wick might indicate buyers stepping in after a dip, signalling potential support.
Certain formations like 'Doji', 'Hammer', or 'Engulfing' patterns hint at price reversals or continuations. Spotting these can prepare traders for changes ahead. For example, a hammer candle after a downtrend in the NGN/USD chart suggests a possible upward bounce.
Candlestick patterns suit Nigerian traders juggling fluctuating naira rates and global forex shifts by providing timely psychological cues alongside price data.
Mastering chart types enhances your forex strategy. Each—line, bar, or candlestick—has strengths to suit different situations in the Nigerian forex market.
By understanding how each displays price data and market sentiment, you position yourself better to make informed trading calls. This practical knowledge helps handle naira volatility with confidence.
Forex charts come alive with indicators and tools that allow traders to make sense of market noise, and in Nigeria's dynamic forex space, these tools are especially useful. They help uncover trends, spot entry and exit points, and manage risk effectively. Here, we highlight key indicators every Nigerian trader should understand.
Simple vs exponential moving averages: Moving averages smooth out price data to identify direction. A Simple Moving Average (SMA) calculates the average price over a set period, giving equal weight to each data point. For example, a 20-day SMA sums prices of the last 20 days and divides by 20. The Exponential Moving Average (EMA), however, gives more weight to recent prices, enabling quicker responses to market changes. This responsiveness can be handy when naira-dollar rates shift swiftly due to Central Bank of Nigeria (CBN) interventions.
Using EMAs can provide timely signals during volatile sessions, but SMAs help confirm established trends. Many traders combine both – say, a 50-day SMA with a 20-day EMA – to balance sensitivity and reliability.
Identifying support and resistance levels: Moving averages also act as dynamic support and resistance. When price pulls back to a rising moving average (support), it might bounce, signalling a good buy point. Conversely, during downtrends, moving averages can act as resistance where price struggles to rise above. For instance, if the ₦–USD pair dips to the 100-day SMA and holds, traders may see that as a buying cue, especially if backed by local economic data like inflation reports.
Understanding these levels helps Nigerian traders plan stop-loss and take-profit points better, rather than guessing blindly amid forex market swings.
Recognising overbought and oversold conditions: RSI measures market momentum on a scale of 0 to 100. Typically, above 70 signals an overbought market, suggesting prices may soon drop, while below 30 indicates oversold conditions, signalling potential upward correction. For example, if naira weakens suddenly and RSI hits above 70, traders should be cautious about chasing buys.
This tool warns against jumping on trends late, like buying naira when it’s already stretched in value.
Using RSI to time entries and exits: More than a warning light, RSI can help decide when to enter or exit trades. A trader might sell when RSI turns down from overbought levels, locking gains before a reversal. Alternatively, spotting RSI rising from oversold territory offers an early buy signal. Pairing RSI signals with other tools, like moving averages, reduces false alarms — essential for Nigerian traders protecting capital in a sometimes choppy market.
Bollinger Bands: These bands form around a moving average, expanding and contracting based on market volatility. When bands tighten, it hints at a coming price spike, while wide bands signal high volatility. Nigerian traders watching currency pairs like GBP/NGN can use Bollinger Bands to plan trades ahead of unpredictable commodity price reports.
MACD (Moving Average Convergence Divergence): MACD tracks momentum shifts by comparing short-term and long-term EMAs. Crossovers of the MACD line and signal line hint at trend changes. For instance, a bullish crossover might suggest the naira is strengthening, a cue for traders to consider long positions.
Fibonacci retracements: This tool identifies likely pullback levels by marking horizontal lines at key Fibonacci ratios—23.6%, 38.2%, 50%, etc. Traders use these to find support or resistance zones during corrections. If the naira-dollar rate retraces 38.2% from a recent high, it might be a sweet spot to enter a trade anticipating the trend resumption.
In Forex trading, blending these indicators equips Nigerian traders with a clearer picture of market direction and timing, which is vital when currency markets respond sharply to local and global economic news.
Using these tools wisely helps you avoid guesswork, making your forex strategy more disciplined and informed.
Using forex charts effectively is vital for Nigerian traders to make informed decisions in a market influenced by both local and global factors. Charts help you identify patterns, spot entry and exit points, and manage risks tied to Nigeria's unique economic environment. By understanding how to choose currency pairs, pick optimal timeframes, and factor in crucial local economic events, you position yourself better to navigate forex trading with increased confidence.
In Nigerian forex trading, the most commonly traded pair is USD/NGN, reflecting the naira against the US dollar, the key currency for Nigeria’s trade and foreign reserves. This pair is highly relevant because it closely tracks Nigeria’s import cost, export earnings, and remittance flows. Other pairs like EUR/NGN and GBP/NGN are less liquid but still important due to trade and investment ties.
Trading these pairs requires close attention to official and parallel market rates in Nigeria since the naira often shows significant differences across markets. For instance, sharp differences in the Bureau De Change (BDC) rate versus the Central Bank of Nigeria (CBN) rate can create arbitrage conditions or sudden volatility spikes.
Forex pairs involving the naira tend to be more volatile than major pairs like EUR/USD or USD/JPY because the naira is susceptible to macroeconomic shocks and policy changes by the CBN. Events such as fuel subsidy reviews or foreign portfolio capital withdrawal can cause sharp price swings.
Understanding this volatility helps you manage risks better—trading during periods of high instability might offer opportunities but also increases exposure. Therefore, Nigerian traders often watch the naira’s stability closely, using stop-loss orders to shield capital from swift adverse moves.
Short-term charts (like 5-minute to hourly intervals) capture quick price movements and suit scalping or day trading strategies common among active Nigerian traders. Long-term charts (daily, weekly) offer broader trends that help identify overall market direction useful for swing or position traders.
Short-term charts can be noisy in highly volatile pairs such as USD/NGN, so using longer timeframes in conjunction improves clarity. For example, spotting a resistance level on a daily chart before executing a short intraday trade provides better context.
Choosing a timeframe depends on your trading objectives. Active traders in Lagos or Abuja, who can dedicate hours daily, may prefer short timeframes to capitalise on rapid price swings. Conversely, others with full-time jobs might use daily or weekly charts to make fewer but well-informed trades.
Mixing timeframes—called multiple timeframe analysis—helps align your entry and exit points with the bigger trend. For instance, a trader could use the 4-hour chart to confirm trend direction and then the 15-minute chart to time entries.
CBN’s policies on interest rates, forex interventions, and foreign exchange restrictions strongly sway forex markets in Nigeria. Traders who monitor CBN’s Monetary Policy Committee (MPC) meetings, FX allocation strategies, or import guidelines can anticipate likely forex market reactions.
For example, a surprise hike in the Monetary Policy Rate (MPR) might strengthen the naira temporarily, reflected on charts as a price rally in USD/NGN. Ignoring such policy shifts can lead to missed opportunities or unexpected losses.
The naira’s exchange rate fluctuates daily on the official and parallel markets. Sudden changes, like a depreciation following fuel subsidy removal or oil price shocks, immediately impact forex charts. Traders should pay attention to both official CBN rates and market sentiments to gauge true price action.
Failure to factor in these changes can cause misreading of chart signals. Aligning analysis with current naira trends helps adjust stop losses, set profit targets, and refine trade timing.
Nigeria’s economy depends heavily on oil, making global oil prices a key driver of naira’s value. When Brent crude prices fall drastically, the naira weakens, which appears clearly on USD/NGN charts as an upward price movement. Similarly, prices of other commodities like cocoa and gas impact forex flows.
Monitoring commodities alongside forex charts allows traders to understand the larger economic wind blowing on the naira. This approach offers an edge, especially during times when commodity price swings trigger sudden forex market moves.
Mastering forex charts is not just about technical shapes but understanding the Nigerian economic heartbeat reflected in those prices. Combining chart analysis with local realities improves your chances of successful trading in Nigeria.
Forex charts are powerful tools, but traders often stumble by focusing too narrowly on the images before them without seeing the larger picture. Understanding common mistakes when reading these charts can tremendously improve your trading accuracy and profitability, especially in the Nigerian context where economic events can sharply sway market behaviour.
Chart patterns and technical indicators sometimes give signals that appear straightforward. However, breaking news—like a sudden change in Central Bank of Nigeria (CBN) policies or an unexpected shift in oil prices—can upend these signals overnight. For example, a bullish setup on a candlestick chart for the NGN/USD pair might be invalidated immediately after a surprise monetary policy announcement that bolsters the naira.
Ignoring external events means you might trade purely on historical price data that no longer reflects the current market mood. In Nigeria’s forex market, local political developments and global commodity prices can cause swift, sharp moves that charts lag in reflecting.
To avoid this pitfall, combine your chart reading with fundamental insights. If Nigeria’s inflation rate spikes or the CBN adjusts interest rates, such news will ripple through forex prices. Understanding these fundamentals alongside charts helps predict whether a price move will sustain or quickly reverse.
For instance, during periods of fuel subsidy removal or FX restrictions by the CBN, the naira’s volatility tends to rise. A chart might suggest a short-term uptrend but knowing the fundamentals can prompt you to place stop-loss orders tighter or avoid risky positions altogether.
Indicators like RSI or MACD are meant to clarify price action, but relying on them exclusively can be misleading. Different indicators often send conflicting messages—RSI might show overbought conditions while a moving average crossover suggests a buy signal.
Traders who follow indicators blindly risk chasing phantom setups or entering trades too late, especially in volatile Nigerian forex markets where rapid fluctuations occur. For example, during ember months, increased trading activity combined with market uncertainties means indicator signals may contradict each other.
Good traders balance indicator readings with direct price action observation. Reading candlestick formations and support-resistance levels provides context that indicators alone may miss. If a bullish engulfing candle forms near a strong support level, it may signal stronger buying pressure than an RSI divergence alone.
Blending these approaches also helps reduce dependence on lagging indicators. It enables timely decisions tailored to the fast-changing Nigerian forex environment.
Many traders overlook the value of predefined stop-loss and take-profit orders. Without these, losses can balloon, especially when the naira suddenly weakens due to unforeseen events. For example, a trader entering long on NGN/USD without a stop-loss could face heavy losses if the Central Bank introduces FX rationing unexpectedly.
Setting clear risk limits protects your capital and frees you from constant chart-watching stress. Both stop-loss and take-profit levels are essential tools to lock in gains and limit damage.
Forex trading can stress nerves, tempting traders into emotional decisions like chasing losses or prematurely closing winners. Nigerian traders often experience this during volatile periods, such as gas price hikes or political uncertainty during elections.
Having a solid risk management plan, including using stop-loss levels and position sizing, helps keep emotions in check. Following your plan prevents panic-driven trades that chart signals alone cannot control.
Successful forex trading comes not just from reading charts, but by combining clear market context, balanced analysis, and disciplined risk control.
Avoiding these mistakes serves you well, especially in Nigeria’s unique forex market, where local developments and global factors interplay in complex ways. Stay sharp, stay informed, and respect both charts and broader market forces.
Learn forex trading basics, strategies, risks, and best platforms tailored for Nigerian traders. Gain practical tips to trade confidently and securely 📈💱🇳🇬
Explore forex trading in Nigeria with insights on regulations, local market, top platforms, risks & tips for beginners. Start smart today! 💹🇳🇬

📈 Master forex trading in Nigeria with practical strategies, risk control, and analysis. Use helpful PDF resources to boost your ₦ earnings confidently and smartly.
Master forex trading in Nigeria with this detailed guide 📈 Learn market basics, key players, strategies, risk management plus tips to earn ₦ safely.
Based on 6 reviews