
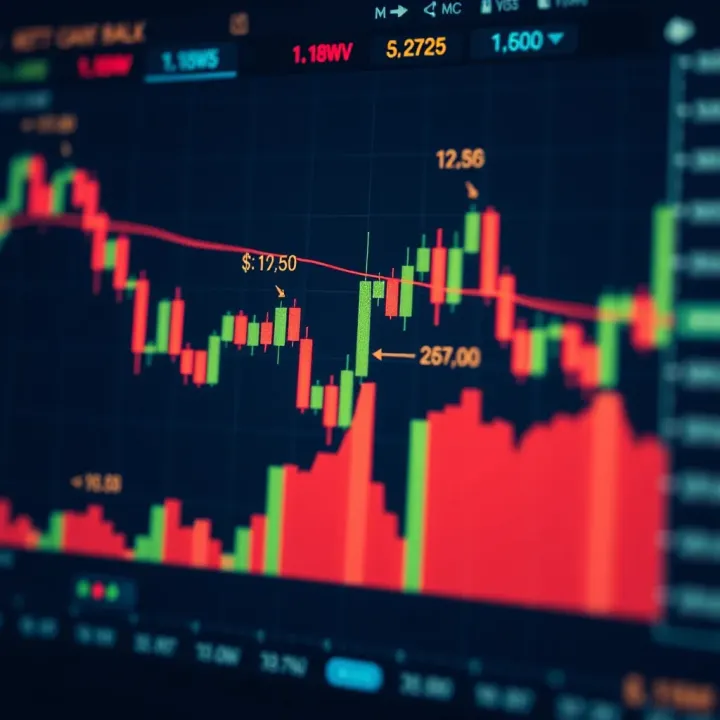
Bullish Candlestick Patterns for Smarter Trading
📈 Learn to spot key bullish candlestick patterns for smarter trading in Nigerian and global markets. Discover how to combine these insights to manage risks and boost your ₦ gains.
Edited By
James Whitaker
Candlestick patterns form the backbone of many traders’ market analysis, offering a straightforward visual way to understand price action and trader sentiment. They originated centuries ago in Japan but remain highly relevant today, especially for Nigerian traders who face fast-moving markets influenced by local events like ember months volatility and naira fluctuations.
At its core, a candlestick shows four key data points within a specific time frame: the opening price, closing price, high, and low. The shape and colour—usually green or red—quickly tell you if buyers or sellers dominated that period. This immediate snapshot helps traders decide whether momentum favours a price rise or fall.
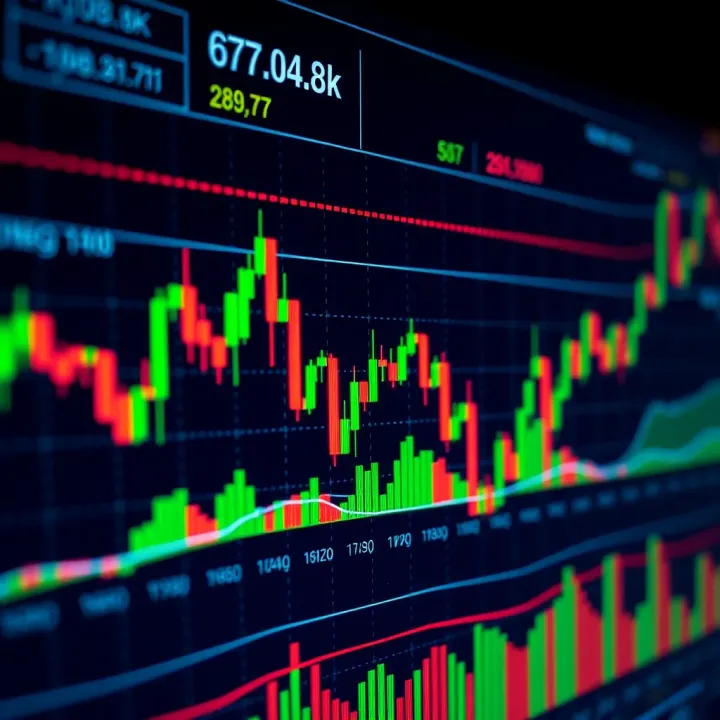
By reading candlesticks, you can detect potential reversals or continuation signals before they appear on conventional charts. This edge can be vital when trading NGX stocks, forex pairs like USD/NGN, or commodities influenced by Nigerian market dynamics.
Understanding how these patterns form is the first step. For instance, a single long green candle with little or no wick often signals strong buying pressure, while a red candle with long upper wick might indicate sellers stepping in. When such candles cluster in identifiable formations, they form patterns reflecting collective market psychology.
Nigerian traders, particularly those active in Lagos or Abuja, can benefit from recognising patterns such as the "Hammer" during ember months, which might indicate a forthcoming price bounce after sell-offs typical of this period. Meanwhile, during stability phases, patterns like "Doji" signal indecision and a likely shift in trend.
Practical use of candlestick patterns involves combining them with volume data, recent news, and support/resistance levels common in Nigerian trading contexts. For example, a bullish engulfing pattern near a known support on the NGX can be a strong buy signal, especially when local economic indicators like CBN policy rates have stabilised.
Keep in mind, candlesticks are not perfect predictors but powerful tools when used alongside other analyses. Mastery comes with practice and paying attention to how Nigerian market peculiarities shape these patterns.
In the next sections, we will explore the most common candlestick patterns and how to apply them effectively for smarter trading tailored to the Nigerian market environment.
Understanding candlestick patterns is a fundamental step for any trader looking to improve their market analysis. These patterns offer a clear visual representation of price movements within a specific period, helping traders gauge market sentiment and make smarter decisions. In the Nigerian trading environment, where markets can be volatile due to naira fluctuations and economic shifts, mastering these basics can give you an edge.
Candlestick patterns are formations created by one or more candlesticks on a price chart. Each pattern provides insights into the tug of war between buyers and sellers during a trading session. By recognising these shapes, you can anticipate potential price direction, enabling you to decide whether to buy, sell, or hold. For example, spotting a ‘hammer’ pattern at a stock’s low price point might suggest a possible reversal upwards.
Historically, these patterns trace back to 18th century Japan, where rice traders used them to track market sentiment and timing. Their effectiveness lies in directly reflecting traders' psychology, from optimism to fear, making them invaluable in today’s fast-paced markets, including Nigerian stock or forex trading platforms.
Every candlestick visualises four price points: the opening price, closing price, the high price, and the low price within the chosen timeframe. For instance, if the opening price is ₦500 and the closing price is ₦520, this upward movement indicates buying pressure in that session. Understanding these four points helps you decode market dynamics beyond simple rise or fall.
The candlestick’s body shows the range between opening and closing prices, while the shadows or wicks depict the extremes—the highest and lowest prices reached. Longer wicks might suggest market uncertainty, for example when a share price in the NSE briefly spikes but pulls back before the close. By paying attention to these details, traders can detect indecision, strength, or weakness in market moves.
Unlike line charts that show only closing prices or bar charts that can seem cluttered, candlestick charts combine all essential price points into a simple, coloured shape. This clarity makes trends and patterns easier to spot at a glance. For example, in Lagos’s fast-moving market, a quick glance at a candlestick chart can provide more actionable info than parsing raw numbers or line plots.
For Nigerian traders, especially those navigating the forex market or local equities on the NGX, candlestick charts offer several advantages. They reveal short-term market sentiment and potential reversals that are crucial when naira value fluctuates, or during volatile periods like the ember months. Plus, many local trading platforms and apps like GTBank’s trading service or Kuda’s investment feature use candlestick visuals, making familiarity with these charts a practical necessity.
Candlestick patterns aren’t just charts; they are a window into market psychology, crucial for making informed, timely trading choices in Nigeria’s dynamic financial markets.
By grasping these basics, you lay the groundwork to spot more complex patterns and sharpen your trading strategy effectively.
Single candlestick patterns offer a direct window into market sentiment, making them essential for traders aiming to make quick decisions. These patterns reflect the balance between buyers and sellers in a single trading session and can signal potential shifts before more complex combinations develop. Nigerian traders often encounter volatile markets, especially during ember months when economic activities spike. Knowing to spot these basic patterns can help anticipate price rebounds or reversals on the Nigerian Exchange (NGX) or forex pairs like USD/NGN.
The Hammer and Hanging Man share a similar shape: a small body at the top or bottom with a long lower shadow. The Hammer usually appears after a downtrend, suggesting buyer strength is emerging despite bears pushing prices lower initially. It signals a possible bullish reversal. On the other hand, the Hanging Man appears after an uptrend, indicating potential weakening momentum and a bearish reversal risk. In a fast-moving market like Nigerian equities, spotting a Hammer at ₦70 per share in a popular stock like Dangote Cement could hint at a rebound, while a Hanging Man warns of profit taking.

Traders should look for confirmation after a Hammer or Hanging Man. For example, entering a long position after a Hammer is safer once the next candlestick closes higher, reinforcing the reversal signal. Exiting or tightening stops near a Hanging Man helps protect profits if the following candle confirms the downtrend. In volatile sessions, combining these signals with volume spikes improves reliability. Nigerian traders sometimes overlook volume data due to limited platforms, but apps like investing.com or NGX trader now make such insights accessible.
A Doji forms when open and close prices are nearly identical, producing a cross or plus-shaped candle. This represents indecision in the market where neither bulls nor bears have control. It often appears at turning points or periods of consolidation. For example, after a strong rally in GTBank shares during ember months, a Doji signals that traders are uncertain whether the uptrend will continue or pause.
There are various Doji types—like the Long-Legged Doji, Dragonfly, and Gravestone—each reflecting different market dynamics. A Dragonfly Doji, with a long lower shadow and no upper shadow, suggests sellers pushed prices down but buyers regained control, often bullish. In contrast, a Gravestone Doji appears after a rally, showing buyers lost control, hinting at possible reversal. Recognising these subtle differences enhances trading precision in markets prone to sudden news-driven swings.
Spinning Tops have small bodies with long shadows, showing indecision and balance between buyers and sellers. They often signal pauses or uncertainty, especially after strong moves. For instance, a Spinning Top spotted in oil sector stocks like Oando during a volatile session may indicate traders are reassessing future price direction.
In contrast, Marubozu candles have no shadows, meaning prices opened and closed at extremes. A Bullish Marubozu suggests strong buying all through the session, while a Bearish Marubozu shows consistent selling pressure. Spotting a Bullish Marubozu in forex pairs like NGN/USD after a positive CBN intervention can confirm upward momentum.
Pay close attention when Spinning Tops appear after a sustained price move, as they may foreshadow pauses or reversals. Marubozu candles deserve attention too, especially near key support or resistance levels. For example, if NGX-listed banks form a Bearish Marubozu near a resistance level of ₦25, traders might prepare for a pullback.
Understanding these single candlestick patterns equips traders with a quick-read tool that helps navigate Nigeria's dynamic markets, improving entry and exit timing with greater confidence.
Multiple-candlestick patterns provide deeper insight into market sentiment than single candlestick formations. These patterns capture shifts in buying or selling pressure over consecutive trading sessions, helping traders anticipate reversals or trend continuations. For Nigerian traders navigating the volatile NGX (Nigerian Exchange Group) or forex markets, recognising these patterns can enhance decision-making amid naira fluctuations and variable liquidity.
A bullish engulfing pattern occurs when a small red (bearish) candle is followed by a larger green (bullish) candle that completely covers the previous day's body. This shows strong buying interest overcoming prior selling pressure, often signalling a potential upward reversal after a downtrend. Conversely, a bearish engulfing happens when a small green candle is followed by a larger red candle engulfing its body, indicating sellers gaining control and possibly a downward reversal.
For Nigerian traders, spotting engulfing patterns requires attention to the candlesticks’ size and position. For example, during ember months when market volumes often thin, engulfing patterns on stocks like Dangote Cement or MTN Nigeria can signal opportunites to enter long or short positions. Confirming these signals with volume spikes or support levels can reduce false alarms in the often choppy Nigerian market.
The morning star and evening star patterns are reliable reversal indicators made up of three candles. The morning star appears after a downtrend and consists of a bearish candle, a small-bodied candle that shows indecision, and a bullish candle breaking above the initial candle’s close. This pattern suggests sellers have lost momentum and buyers are stepping in. The evening star is the mirror image, signalling a likely reversal from an uptrend to downtrend.
In practical Nigerian trading, these signals work well with NGX stocks or currency pairs like USD/NGN where trend reversals often happen around significant news or policy shifts. For instance, during periods of CBN monetary policy announcements, observing a morning star on a blue-chip stock or forex chart can help traders anticipate a bullish rally.
The three white soldiers pattern comprises three consecutive bullish candles, each closing higher than the last. It suggests a strong, sustained uptrend driven by persistent buying. The opposite, three black crows, shows three bearish candles closing lower successively, signalling steady downward momentum.
These patterns are particularly useful for Nigerian traders focusing on longer-term positions. For example, when the NGX All-Share Index forms three white soldiers after a correction, it may indicate a reliable buying window. Integrating volume data confirms the pattern’s strength—high volume alongside these candles points to genuine trader commitment rather than short-lived price moves.
Always combine multiple-candlestick signals with other technical indicators and market context before acting. Patterns alone don’t guarantee success but improve the odds when used wisely.
Using volume and indicators like RSI or moving averages helps confirm these sustained trends. For instance, rising volume and an RSI climbing past 50 during three white soldiers' formation adds weight to the bullish case. Nigerian traders who blend these tools tend to manage risks better, especially in erratic markets impacted by naira volatility and external shocks.
Candlestick patterns gain real value when combined carefully with practical market analysis. Traders don’t just look at a pattern and jump into a trade; understanding the broader context is key. For instance, spotting a bullish engulfing pattern near a solid support level can suggest a strong buying opportunity, whereas seeing the same pattern in a generally weak market demands caution. Real trading isn't about guessing; it's about stacking evidence to make the smartest moves.
Support and resistance levels are essential in confirming candlestick signals. Support levels indicate price points where demand usually spikes, halting further decline. Resistance works the opposite way, marking price points where selling pressure tends to increase. When a candlestick pattern forms near these levels—say, a hammer at a support zone—it signals potential price reversals. Nigerian traders can often spot such patterns on the Nigerian Stock Exchange (NGX) when prices bounce off key levels, helping to time entries and exits better.
Moving averages smooth out price data to show the overall trend, helping confirm candlestick signals. For example, if a morning star pattern appears above the 50-day moving average, it tends to carry more weight, indicating a likely upward shift. The Relative Strength Index (RSI) offers clues about overbought or oversold situations. A candlestick pattern showing reversal accompanied by an RSI reading below 30 (oversold) increases the probability of a bounce. Using these technical indicators alongside candlestick patterns creates a more reliable setup for trading decisions.
Relying solely on candlestick patterns without considering the market environment often leads to costly errors. For instance, a bullish pattern in a downtrending forex market or during political uncertainty in Nigeria might not play out as expected. It’s important to gauge broader market sentiment, news impact, and volume levels before making moves.
Candlestick patterns don't work in isolation. Betting everything on one pattern, like the doji, without supporting confirmation can cause false signals. For example, spotting a hammer does not guarantee a trend reversal unless supported by volume or other indicators. Nigerian markets, with their volatility—especially during ember months—demand that traders combine multiple signals with sound risk management.
The naira’s fluctuating value can affect trade outcomes, especially in forex and commodities. Nigerian traders should factor in currency volatility, using tight stop-loss orders to protect capital. Hedging strategies or diversifying asset classes—such as mixing Nigerian equities with foreign stocks or forex pairs—help cushion against sudden naira swings.
Nigerian markets react significantly to news and economic announcements. Trading just before key events like CBN policy meetings or petrol subsidy decisions can be risky. It's wiser to wait for light volatility phases or trade after news digest. Also, understanding the NGX trading hours and peak liquidity times can improve trade execution and reduce slippage.
Combining candlestick patterns with support, resistance, momentum indicators, and contextual knowledge helps Nigerian traders make smarter, more confident trading decisions — avoiding pitfalls and managing risks effectively.
Mastering candlestick patterns requires more than just theory; practical learning resources play a vital role. For Nigerian traders, accessing reliable books, online courses, and interactive platforms can build solid skills to interpret market movements effectively. These resources offer structured knowledge and simulate real trading conditions, helping traders move beyond guesswork.
Selecting the right book or course tailored to your experience level is essential. Beginners benefit from titles like "Japanese Candlestick Charting Techniques" by Steve Nison, often regarded as the foundation text for understanding candlesticks. For intermediates, "Encyclopedia of Candlestick Charts" by Thomas Bulkowski provides deeper insight into pattern variations and their probabilities, which is valuable when applying these patterns in dynamic Nigerian markets like the NGX or forex trading.
Online courses complement books by offering updated, interactive content that can fit around your schedule. Platforms such as Coursera and Udemy frequently host candlestick trading courses designed to walk learners through pattern recognition, chart reading, and combining candlestick analysis with other indicators. Some courses offer quizzes and case studies relevant to emerging markets, which resonate with the volatility and trading behaviour Nigerian investors experience.
In Nigeria, several trading apps provide demo accounts where you can practice candlestick analysis without risking real money. Apps like EasyEquities, Trove, and the MTN Mobile Money investment platform let users simulate trades on local stock market data or forex pairs. Practising on these apps sharpens your ability to spot patterns in live market conditions and understand their impact on price movements.
Simulating trades with candlestick charts involves setting up virtual portfolios and using real-time data feeds to observe how patterns play out. This hands-on approach lets you test different strategies, such as combining the morning star pattern with RSI overbought/oversold signals, without financial pressure. Over time, this builds confidence and refines your entry and exit timing, especially important in the naira’s fluctuating environment.
Effective learning resources paired with hands-on practice form the backbone of successful candlestick trading journeys, particularly in Nigeria’s complex and fast-changing markets.
By using recommended books, online courses, and demo accounts together, you prepare yourself to make smarter trading decisions. Whether you want to trade on the NGX or forex, these tools give you insights and simulate the real stakes, turning knowledge into action.
📈 Learn to spot key bullish candlestick patterns for smarter trading in Nigerian and global markets. Discover how to combine these insights to manage risks and boost your ₦ gains.
📉 Learn how bearish candlestick patterns signal possible market dips. Get tips to spot, interpret, and use them smartly in trading decisions.
📊 Master 35 essential candlestick patterns for smarter trading! Learn how to spot trends, interpret signals accurately, and boost your strategy with practical tips and PDF guides.

💱 Understand forex trading: how the global currency market works, key players, methods, risks & rewards for Nigerian traders. Make smarter moves with forex insights today!
Based on 11 reviews