
Forex Candlestick Patterns Explained for Nigerian Traders
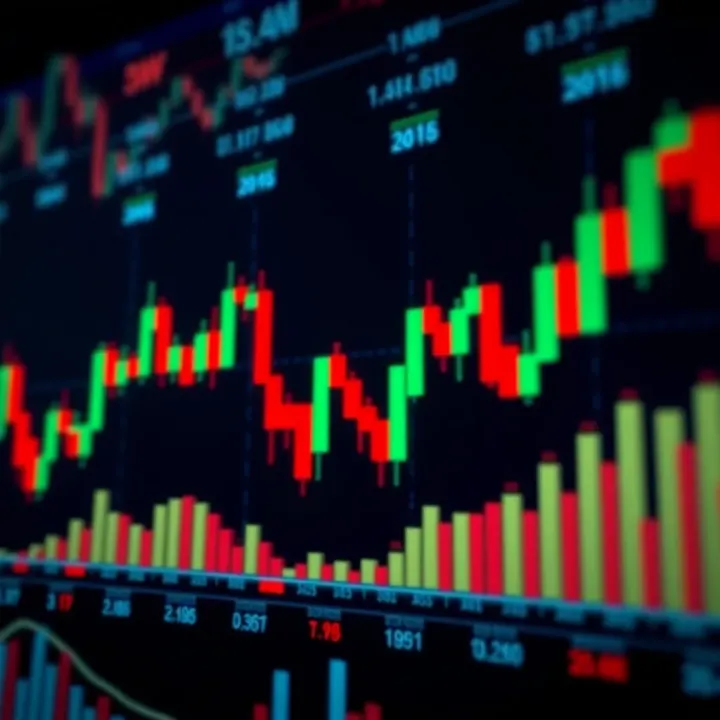
📊 Master forex candlestick patterns to trade smarter in Nigeria’s market. Learn how to spot price moves, reversals, and continuations with relevant local examples.
Edited By
Thomas Reed
Candlestick patterns are one of the most useful tools for traders analyzing price movements in Nigerian stock, forex, and cryptocurrency markets. They provide visual cues about market sentiment — whether buyers or sellers hold the upper hand. Mastering these patterns helps traders make quicker, more informed decisions without relying heavily on complex indicators.
At their core, candlestick charts display opening, closing, high, and low prices for a given period. Patterns formed by these candles often signal potential reversals or continuations in price trends. Nigerian traders can especially benefit from recognising reliable formations that adapt well to volatile markets like the Nigerian Exchange (NGX) or the forex scene influenced by naira fluctuations.
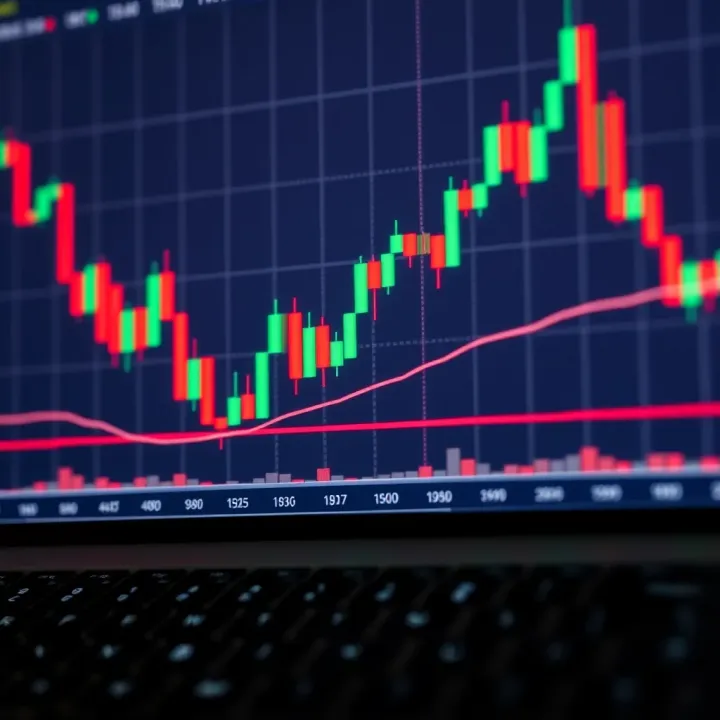
Learn to spot bullish and bearish signals in price action through simple, repeatable candlestick shapes and enhance your trading strategy confidently.
Clear visual signals: Unlike raw numbers, candlestick patterns offer a quick snapshot of investor psychology.
Work across markets: Whether trading MTN shares on the NGX, forex pairs like USD/NGN, or Bitcoin on local exchanges, candlesticks apply universally.
Complement other tools: Using volume or moving averages alongside patterns can confirm entry or exit points.
Swift identification: In fast-paced markets, quick recognition helps to avoid losses and seize profit opportunities.
When applying candlestick patterns, Nigerian traders should:
Use patterns as part of a bigger picture, not standalone signals.
Confirm patterns with volume changes or technical indicators.
Test strategies in demo accounts before trading live.
Stay alert to market conditions specific to Nigeria, like fuel subsidy news or power outages affecting economy.
This guide will soon break down the most reliable bullish and bearish candlestick patterns tailored for Nigerian traders looking for a no-nonsense approach to price action analysis.
Understanding how candlesticks work is the foundation every trader must build on before interpreting market moves. Candlestick charts display price movements within a specific period — be it minutes, hours, days, or weeks — helping traders decode market sentiment swiftly. Unlike line charts that just connect closing prices, candlestick charts reveal more detail, giving Nigerian traders an edge in spotting potential reversals or continuation signals.
A single candlestick reflects how price has moved over a chosen timeframe. It summarises four price points: the opening, closing, highest, and lowest prices. These four prices together tell a story of buyer and seller battles during that period. For example, a long green (or white) candlestick shows buyers dominated, pushing prices higher. Conversely, a long red (or black) candle indicates sellers had the upper hand, driving prices down. Candlesticks, therefore, compress complex market data into an easy-to-read visual format.
The body forms the main part of a candlestick. It represents the range between the opening and closing prices. If the close is higher than the open, the body is usually green or white, signalling bullish momentum. When the close is lower, the body is red or black, indicating bearish pressure. For Nigerian traders, observing the body size helps gauge strength; a long body suggests strong movement, while a short body shows indecision or consolidation.
Wicks or shadows are the thin lines extending above and below the body, showing the highest and lowest traded prices during the period. The length of wicks can reveal market volatility and rejection zones. A long upper wick tells us sellers pushed price down after buyers tried to raise it, while a long lower wick suggests buyers stepped in after sellers drove price lower. These clues are useful for Nigerian markets often affected by sudden economic news or regulatory shifts, where price swings can be sharp.
Knowing the exact open, close, high, and low prices adds precision to analysing candlestick patterns. The open price signals where trading began, while the close price shows where it ended — this pairing defines the body colour and size. The high and low prices set the extremes traders tested but failed to hold. For example, a candle with a small body but large wicks signals uncertainty, common around key events like CBN monetary policy announcements affecting forex and stock markets. Nigerian traders benefit by reading these details to anticipate possible trend changes.
Candlestick patterns distil complex price action into identifiable figures, enabling traders to make faster decisions. In Nigeria’s fast-moving markets — from the NGX to forex and crypto platforms like Binance or Luno — spotting clear bullish or bearish signals can mean seizing profit opportunities or cutting losses early. These patterns also provide context to complement other analyses like volume, news, and macroeconomic shifts specific to Nigeria, such as Naira devaluation or fuel subsidy changes. In essence, mastering candlestick basics sharpens traders’ instincts and helps navigate the volatility common in Nigerian financial markets.
Understanding candlesticks isn’t just technical jargon; it’s a practical skill that transforms price charts into actionable guides for trading smarter and safer in Nigeria’s unique market environment.
Bullish candlestick patterns serve as critical signals indicating potential upward price movements, especially useful for traders in Nigeria’s dynamic markets. Recognising these patterns can help you time entries more effectively, reducing the risk of premature buys in volatile conditions like the Nigerian stock or forex market. This section covers four widely observed bullish patterns, highlighting their formation, meaning, and practical implications.
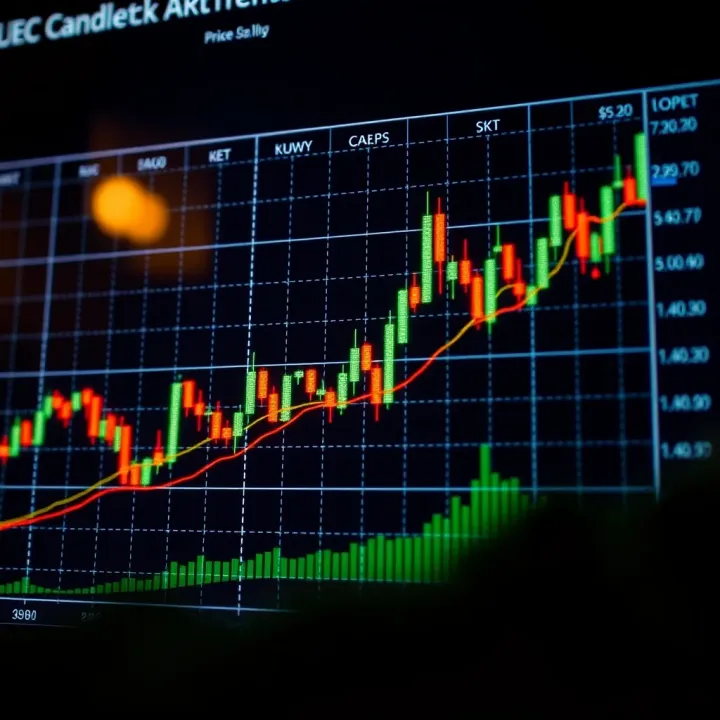
The Hammer is a single candlestick with a small body near the top, a long lower wick, and little or no upper wick. It typically appears after a price decline and suggests buyers are stepping in to push prices higher. Think of it as a sign that the market tested lower levels but refused to stay there. The Inverted Hammer resembles the Hammer but has a long upper wick and a small body near the bottom, signalling potential support too but usually requires stronger confirmation. For example, if you spot a Hammer on a NGX-listed stock like Dangote Cement after a strong dip, it could hint at a bounce reversal.
This two-candle pattern begins with a small bearish candle followed by a larger bullish one that completely 'engulfs' the previous body. The size difference shows a sharp shift in momentum from sellers to buyers. This pattern often marks the start of an uptrend, especially if it forms near support levels. Nigerian traders might see this on forex pairs like USD/NGN during intervention periods when demand shifts visibly towards the naira.
The Morning Star is a three-candle pattern signalling a strong bullish reversal. It starts with a long bearish candle, followed by a small-bodied candle that gaps down showing indecision, and then a large bullish candle that closes well into the first candle's body. This pattern suggests exhaustion of selling pressure and growing buying interest. For instance, you may spot a Morning Star formation in the cryptocurrency market during volatile periods when investors regain confidence.
This pattern involves two candles; the first is bearish and the second bullish, which opens below the first candle’s low but closes above its midpoint. The Piercing Line suggests that buyers are gaining control after a dip, pushing prices significantly higher within the same trading period. Traders dealing with volatile stocks or forex markets like Nigerian Treasury Bills could use this pattern to anticipate price rebounds.
Recognising these bullish patterns within the appropriate Nigerian market context — factoring in volume, news, and liquidity — greatly improves trading decisions and timing.
By understanding and watching out for these formations, you can better navigate the ups and downs of Nigerian financial markets, spotting potential buy signals with greater confidence.
Recognising key bearish candlestick patterns is vital for traders who want to protect gains or identify potential downturns early. These signals suggest sellers are gaining control, pointing to possible price declines. Nigerian traders, whether dealing in the NSE, forex pairs like USD/NGN, or cryptocurrencies, can sharpen their decision-making by spotting these patterns. Understanding them helps to time exits or prepare for short trades.
Both the Shooting Star and Hanging Man look alike but signal different things based on prior market direction. The Shooting Star forms after an uptrend, with a small body near the day’s low and a long upper wick. This shows buyers pushed prices up, but sellers took over by close, hinting at a potential reversal downward. For example, if MTN’s stock rises steadily but suddenly forms a Shooting Star candle on a clear, high volume day, it could indicate profit-taking ahead.
The Hanging Man, meanwhile, appears after an uptrend too, but it has a small upper wick and a long lower wick. It reflects sellers pushing prices significantly lower during the day, despite buyers pulling prices back near the open. This suggests buyer strength is weakening and sellers might soon dominate. Nigerian traders often find confirming volume crucial here — if volume spikes along with the Hanging Man, it strengthens the reversal signal.
A Bearish Engulfing pattern is straightforward but powerful. It happens when a large bearish candle fully covers the small bullish candle before it. This “engulfing” shows a shift in sentiment, from buyers to sellers. For traders following Nigerian equities or even forex pairs, this pattern can flag strong selling pressure.
Take a stock like Dangote Cement: if after a few days’ modest gains it prints a Bearish Engulfing on high volume, this might warn that a pullback is near. In volatile settings like the Nigerian forex market, using this in combination with other indicators boosts confidence in acting quickly.
The Evening Star is a three-candle pattern signalling a solid bearish reversal. It starts with a strong bullish candle, followed by a small-bodied candle (often a Doji), then closed off by a large bearish candle that leans deep into the first candle’s gains. This pattern reflects indecision turning decisively into selling pressure.
In practical terms, if you spot an Evening Star after a strong rally in a stock like Zenith Bank, it’s wise to tighten stop losses or plan exits. Traders on crypto exchanges servicing Nigerian users should equally watch for this, given crypto’s volatility.
The Dark Cloud Cover appears when a bearish candle opens above the prior bullish candle’s close but closes well into its body, not quite engulfing it but signalling sellers took control mid-session. It implies buyers’ momentum is faltering and bears are pushing back hard.
For traders watching Nigerian fixed income-linked ETFs or oil and gas stocks, this pattern can be a warning to prepare for possible corrections. Checking alongside volume or macroeconomic events helps avoid acting on false signals in Nigeria’s sometimes choppy markets.
Those who master these bearish candlestick patterns gain a meaningful edge in timing their market moves, helping avoid serious losses or capitalise on shorts. Combine pattern recognition with Nigerian market realities and relevant technical tools to trade more confidently.
Candlestick patterns provide key insights into market sentiment, but using them effectively requires Nigerian traders to consider local market nuances. The fluctuations in Nigeria’s stock markets or forex trading can be quite sharp, influenced by factors like economic reports, political developments, and liquidity constraints. Correctly interpreting these patterns alongside other signals can make the difference between profit and loss.
Volume acts as a vital confirmation tool when spotting candlestick patterns. For example, a bullish engulfing pattern gains credibility when accompanied by increased trading volume on the Nigerian Stock Exchange (NGX). This suggests a genuine shift in market interest rather than a random blip. Combining volume readings with other indicators, such as the Relative Strength Index (RSI) or Moving Average Convergence Divergence (MACD), can further validate the trend. If a pattern forms but is unsupported by volume or technical indicators, it may signal a weak or false move.
Nigerian markets are often volatile due to factors like naira fluctuations and fluctuating oil prices. This volatility can trigger false candlestick signals if traders rely solely on price action. For instance, an apparent bullish pattern might quickly reverse amid unexpected policy announcements or forex scarcity. To avoid falling for these traps, traders should wait for additional confirmation, such as subsequent candles supporting the initial pattern or volume surges that back price moves. Employing stop-loss orders also helps limit potential losses when patterns fail.
Liquidity—or the ease of buying and selling—varies widely across Nigerian assets. Stocks with low daily turnover, like some local telecoms or blue-chip shares, may produce distorted candlestick patterns. Low liquidity often leads to erratic price swings, so patterns here require extra scrutiny. For instance, a hammer pattern on a thinly traded stock could be less reliable compared to the same pattern on actively traded shares such as Dangote Cement or MTN Nigeria.
Liquidity issues also arise in forex markets, especially for the naira against less-traded currency pairs. Nigerian traders should consider liquidity levels before placing trades based on candlestick setups, as thin markets tend to generate noise rather than clear trends.
Economic releases, like the Central Bank of Nigeria (CBN) monetary policy announcements, inflation figures, or fuel subsidy decisions, often spark sharp market moves that affect candlestick patterns. For example, a bearish engulfing pattern might reflect genuine market pessimism following a negative CBN policy decision, but it could also represent an overreaction that quickly reverses.
Regulatory changes from agencies like the Securities and Exchange Commission (SEC Nigeria) or sudden shifts in import policies can also disrupt typical price patterns. Traders should track the Nigerian news landscape closely and blend this information with patterns. Combining fundamental awareness with technical analysis helps prevent misreading signals caused by external shocks.
Always confirm candlestick patterns with volume and broader market context before committing your capital in Nigeria’s dynamic trading environment.
Using candlestick patterns alongside volume and market conditions sharpens decision-making and reduces the risk of false signals. Nigerian traders who tailor their approach to local liquidity and economic news stand a better chance of capturing true market moves.
Building a cheat sheet for candlestick patterns is an essential step for Nigerian traders who want to sharpen their market analysis skills efficiently. A well-organised cheat sheet acts as a quick reference during live trading sessions or chart reviews. It saves time and boosts confidence by highlighting the most actionable patterns, helping traders avoid guesswork amid fast-paced market movements. More importantly, it enables you to approach trading with a clear, methodical mindset rather than relying on memory alone.
Not all candlestick patterns hold the same weight across different markets or timeframes. When building your cheat sheet, focus on patterns that have shown consistent performance in Nigerian equities, forex, or crypto markets. For instance, the Bullish Engulfing and Morning Star patterns commonly signal strong reversals and suit medium-term trades. On the other hand, some less obvious patterns like the Piercing Line gain effectiveness when confirmed by volume or other indicators. Keep track of patterns that align well with local market behaviour, such as reactions to economic announcements by the Central Bank of Nigeria (CBN), to reduce false signals.
Colour coding your cheat sheet makes key patterns stand out instantly. Assign green hues to bullish formations and red shades to bearish ones. You might use a light yellow background for neutral or continuation patterns if you include them. This separation helps your eyes quickly spot the likely direction of the market without wavering in indecision. In practice, this is like having traffic lights on your chart: green for 'go long,' red for 'consider selling or exiting'. For Nigerian traders, where timely decisions can mean significant profit or loss due to market volatility, such visual cues are priceless.
Incorporate clear markers on your cheat sheet for ideal entry and exit points for each pattern. For example, mark the body of a Hammer candle with an arrow pointing upwards to suggest a potential buy entry above its high, while placing a stop-loss below its wick. Similarly, highlight exit points after a Bearish Engulfing pattern near the candle’s low to lock in profits before a downtrend intensifies. This practice ensures you don't just recognise patterns but also know how to act on them practically, which is crucial when trading Nigerian stocks or forex pairs where sudden reversals are common.
Having a cheat sheet is no good without actual practice. Regularly review live or historical charts of Nigerian stocks, currencies like the NGN/USD pair, or popular cryptocurrencies to spot patterns in action. Platforms like the Nigerian Stock Exchange (NGX) website or MTN stock charts can be good starting points. The more you see patterns unfold with real price movement, the better you become at identifying them swiftly and accurately during your own trades. Practical exposure also helps you appreciate the nuances of local market sentiment driven by political events, ember months activity, or regulatory shifts.
Keep your cheat sheet simple and always complement it with ongoing chart practice. This combination builds practical trading skills, helping Nigerian traders make smarter decisions in fast-changing markets.
📊 Master forex candlestick patterns to trade smarter in Nigeria’s market. Learn how to spot price moves, reversals, and continuations with relevant local examples.
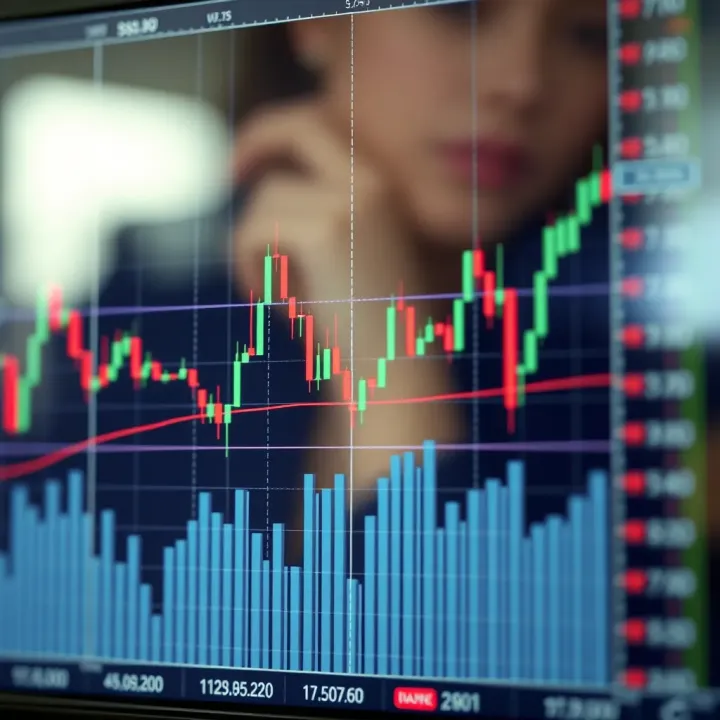
📈 Learn how to spot key forex chart patterns like reversals and continuations to improve your trading game. Master practical tips suited for Nigeria’s forex market today!

Explore a detailed guide on candlestick patterns 📈 for traders in Nigeria and beyond. Learn to spot, interpret, and apply these formations for smarter trades.
📊 Discover key candlestick patterns, understand trader sentiment, and access essential PDF guides to improve your stock market strategies effectively.
Based on 10 reviews