
Bullish Candlestick Patterns for Smarter Trading
📈 Learn to spot key bullish candlestick patterns for smarter trading in Nigerian and global markets. Discover how to combine these insights to manage risks and boost your ₦ gains.
Edited By
Amelia Wright
Trading in Nigeria’s vibrant markets demands a solid grasp of chart patterns. These formations on price charts offer clues about potential market direction, helping traders and investors decide when to buy or sell. Understanding chart patterns can significantly improve your timing and confidence in making trades, reducing guesswork.
Chart patterns emerge from the collective behaviour of market participants, reflecting shifts in buying and selling pressure. Nigerian markets, including stocks on the Nigerian Exchange (NGX) or commodities like crude oil, often show familiar patterns that repeat over time. Recognising them is a skill that traders develop to navigate price swings successfully.
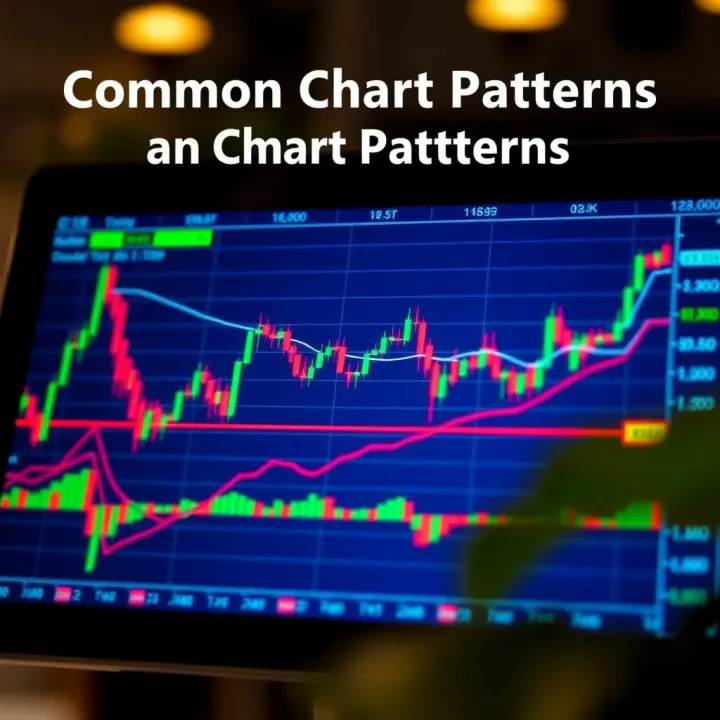
You'll encounter two broad categories of chart patterns: reversal patterns and continuation patterns. Reversal patterns signal a possible change in trend direction, while continuation patterns suggest the current trend will keep going. For example, an ascending triangle often points to a bullish breakout, while a head and shoulders formation may hint at an impending downtrend.
Mastering simple chart patterns allows you to anticipate market moves before they happen. This edge is especially valuable in Nigeria's fast-moving markets, where reaction time and sharp analysis matter.
Here are some key points to remember:
Patterns are not guarantees; they indicate probabilities based on historical behaviour.
Combining pattern analysis with other tools such as volume, moving averages, or the Nigerian interbank rates can strengthen your decisions.
Practice is crucial—observe live NGX charts to see how familiar patterns play out in real time.
This guide breaks down the most common chart patterns seen in trading across Nigerian equities, forex, and commodities. You will learn how to spot each pattern, understand what it implies, and use that knowledge for smarter entries and exits.
Whether you trade GTBank shares, forex pairs like USD/NGN, or agricultural commodities, the principles remain the same. Equip yourself with these charting basics to trade more strategically and avoid common pitfalls.
Chart patterns are visual formations seen on price charts that reflect the collective behaviour of traders. They represent repeated movements where price tends to react in certain ways. Recognising these patterns allows traders to read market sentiment without guesswork. For example, a "head and shoulders" pattern often signals a potential trend reversal, hinting at a possible price drop after a sustained rise.
Chart patterns are essentially snapshots of supply and demand dynamics. They capture how buyers and sellers interact over time in the market. For instance, a "triangle" pattern shows a consolidation phase where buyers and sellers battle until one side gains upper hand, triggering a breakout. This representation helps traders anticipate the next move based on past collective behaviour.
In Nigeria’s often volatile markets—whether in stocks like MTN Nigeria or Forex pairs such as USD/NGN—understanding chart patterns sharpens decision-making. Given the naira’s fluctuations and frequent market shocks, these patterns can offer clues beyond just fundamentals. They help traders spot entry or exit points so you avoid being caught on the wrong side. Nigerian traders dealing in equities on the NGX or cryptocurrencies will find that chart patterns reduce guesswork, making trading more systematic.
Chart patterns act like signposts. When you spot a continuation pattern, such as a flag or pennant, it suggests the current trend will likely persist. Conversely, reversal patterns signal a possible end to the trend. For example, after a period of upward momentum, a double top pattern might foreshadow a dip. Combining these visuals with volume data sharpens predictions—if volume increases during a breakout, it confirms strength.
Mastery of chart patterns adds a valuable edge when navigating Nigeria’s diverse markets. It gives you practical signals to guide your buy and sell decisions.
In sum, chart patterns are practical tools reflecting real trading behaviour. Nigerian traders who can read them well move beyond guesswork, using clear visual cues to anticipate market moves and act confidently.
Recognising basic types of chart patterns is an essential skill for traders in Nigeria’s vibrant markets. These patterns provide quick visual cues about potential price moves, helping investors decide when to enter or exit trades. Understanding key types like continuation and reversal patterns equips you with practical tools for reading market sentiment and momentum.

Flags and Pennants are short-term continuation patterns signalling a pause before the existing trend resumes. Imagine a stock price zooming like an okada darting through Lagos traffic, then taking a short rest—that pause forms a flag or pennant on the chart. Flags look like small rectangles slanting against the trend, while pennants resemble tiny symmetrical triangles. When volume dips during this pause and picks up again with a breakout in the trend’s direction, traders catch profitable moves early. In the Nigerian stock market or forex scene, spotting these means you can hold your positions confidently or add to them, expecting the momentum to continue.
Rectangles represent consolidation zones where prices bounce between clear support and resistance levels. Picture a keke napep weaving between two traffic cones: it moves sideways but is ready to pick a new direction. When prices break out of this rectangle, it often signals a strong move either upward or downward. This pattern helps you avoid premature jumps during indecisive market conditions, particularly when volatility is high, such as during ember months or political events.
Triangles suggest a tightening price range, readying for a breakout. These come in three forms: ascending, descending, and symmetrical triangles. For example, an ascending triangle often indicates rising buying interest pushing highs higher, relevant for stocks like Dangote Cement during periods of strong economic activity. Recognising these can tell you whether to expect bullish or bearish continuation, especially when combined with local news or CBN policy changes that affect market liquidity.
Head and Shoulders is a classic reversal pattern signalling that an existing trend may be ending. It resembles a crude drawing of a head between two shoulders, where the price peaks (or troughs) form distinct shapes. For traders dealing in the Nigerian equities market, seeing this pattern after a surge in a stock like MTN or Nestlé Nigeria could hint it’s time to take profits. The inverse version warns of a change from downtrend to uptrend.
Double Tops and Bottoms are straightforward reversal signs. A double top looks like a price hitting a ceiling twice before falling, while a double bottom appears as two troughs at a similar level before rising. Picture a local football match where the ball hits the crossbar twice and then rebounds downhill. This pattern is practical for forex traders watching NGN currency pairs; repeated resistance or support levels often mark a shift in trader sentiment.
Triple Tops and Bottoms extend this idea with three touches at resistance or support, making the reversal signal more reliable. Since the Nigerian market can be volatile, triple patterns give a better indication that the trend has truly exhausted itself before shifting directions. For example, a triple bottom in a commodity like crude oil prices can alert investors to a strong potential rise, considering Nigeria’s oil-dependent economy.
Mastering these basic patterns enables you to read charts like a pro, spotting when trends pause, continue, or end. This skill enhances your timing in making trades, crucial in fast-moving markets where every naira counts.
Recognising and correctly interpreting chart patterns is vital because it helps traders forecast probable price moves before they actually happen. This skill reduces guesswork and increases the likelihood of making sound trading decisions. Nigerian traders, whether dealing in stocks listed on the Nigerian Exchange (NGX), forex pairs, or cryptocurrencies, must develop a sharp eye for these patterns to navigate the market’s ups and downs effectively.
Not all chart patterns hold the same weight. Spotting reliable ones requires understanding context and confirmation signals. For instance, a well-formed head and shoulders pattern on a stock like MTN Nigeria usually predicts a reversal from bullish to bearish. But if the right shoulder volume is low or price doesn’t break the neckline decisively, the pattern may be false. To spot trustworthy patterns, look for:
Clear and repeated price points forming the pattern
Breakouts or breakdowns confirmed by follow-through price action
Pattern formation over a suitable timeframe to avoid noise
Using candlestick charts alongside line or bar charts can also give a better view of how price behaves at critical points.
Volume is often the unsung hero in chart interpretation. It shows the strength behind price moves. A classic example is the flag pattern: during the flag formation, volume usually decreases, signalling consolidation. When price breaks out, volume should spike to confirm the breakout’s strength.
In the Nigerian context, where markets can be thinly traded, volume data helps avoid traps. For example, using NGX volume figures, a breakout on Nigerian Breweries shares with low volume might be weak or fake. Always check whether volume supports the price action before acting.
Volume acts as a gatekeeper—without its confirmation, patterns can mislead even experienced traders.
Many traders fall for avoidable errors when working with chart patterns. One common mistake is ignoring the broader market trend. For example, trying to trade a reversal pattern against a strong uptrend in the Nigerian oil sector could bring losses if the pattern is premature.
Another frequent error is neglecting risk management. Even the most reliable pattern fails sometimes, so placing stop-loss orders just beyond pattern boundaries is necessary. Over-relying on patterns without considering fundamental news, such as CBN policies or forex liquidity shifts, also leads to trouble.
Lastly, impatience damages results. Traders sometimes enter too early, not waiting for breakout confirmation, or exit too soon before the pattern plays out fully. Taking time to observe patterns over several sessions and cross-checking with volume or other indicators improves success.
By mastering how to read and interpret chart patterns with these practical checks, you sharpen your trading edge, reducing false signals and making decisions that can stand the test of Nigeria’s volatile markets.
Using chart patterns wisely in Nigeria's markets calls for some local awareness and cross-checking with other tools. Nigerian traders, whether dealing in stocks on the Nigerian Exchange (NGX), foreign exchange, or cryptocurrencies, benefit from grounding patterns in real market context and supporting data.
Relying entirely on chart patterns can be risky. Combining them with indicators like moving averages, the Relative Strength Index (RSI), or Bollinger Bands sharpens insight. For example, spotting a bullish flag pattern confirmed by a rising RSI strengthens confidence in upward momentum. Similarly, volume analysis is key — high volume during pattern breakout signals stronger price action. Nigerian traders using platforms like MTN or Glo’s mobile broadband can access real-time data to track these multiple signals closely.
Nigeria’s markets sometimes react to factors beyond charts: political announcements, CBN policies, or fuel subsidy changes affect investor behaviour fiercely. The naira’s volatility versus the dollar can make forex chart patterns less predictable, and stock liquidity varies widely across sectors like banking or telecoms. For instance, during ember months, increased spending or election season jitters often skew typical price behaviours. Nigerian traders should adjust stop-loss orders and target levels accordingly rather than blindly following textbook patterns.
Each asset class in Nigeria requires a tailored approach to chart patterns. Forex traders dealing with pairs like USD/NGN must consider irregular spikes from central bank interventions. Stocks from companies such as Dangote Cement or MTN Nigeria exhibit different patterns due to sector fundamentals and market depth. Cryptocurrencies traded on Nigerian exchanges, including Bitcoin and Binance Coin, present highly volatile charts but often yield clear breakout or reversal patterns useful in intraday trading. Exercising caution and using time frames that suit each market’s rhythm ensures better pattern reliability.
Successful Nigerian traders don't just spot a pattern; they balance it with volume, local news impact, and technical confirmations before taking action.
By understanding these nuances and integrating chart patterns with other insights, Nigerian traders can make sharper entry and exit decisions, reducing costly mistakes and boosting their chances of profit.
Access to quality resources significantly shapes how well traders master chart patterns. Proper materials and practice tools help traders deepen their understanding and apply patterns effectively in real-life situations, especially within Nigeria's unique market settings. Without reliable resources to learn from and practice on, many traders can struggle to convert theory into profit.
A solid foundation begins with trusted books and platforms that cover chart patterns in detail. Technical Analysis of the Financial Markets by John Murphy remains a top pick for a comprehensive grasp of patterns and indicators. Nigerian traders may find value in books by local experts who include examples from the Nigerian Stock Exchange (NGX) and Forex markets.
Online platforms like Investopedia and BabyPips offer free tutorials and quizzes suited for beginners and intermediates. For active practice, platforms such as TradingView allow users to simulate trades using live market data, including Nigerian equities and forex pairs. These tools provide practical exposure without risking actual funds.
Hands-on experience is crucial. Using Nigerian market data, traders can test how chart patterns perform in familiar conditions influenced by local economic and political factors. For instance, practising pattern recognition on NGX-listed stocks such as Zenith Bank or Dangote Cement reveals how patterns react amid market shocks or ember months volatility.
Several Nigerian fintech companies like InvestNow and Bamboo provide access to historical stock prices and charts. Working with these helps traders understand patterns’ reliability before deploying real money. Regular practice also builds discipline and timing skills critical for success.
Joining discussions with fellow Nigerian traders sharpens insights and offers localised tips often missing in generic guides. Active communities on platforms like Nairaland, Lagos Traders Forum, and the various social media groups focused on the Nigerian market provide spaces to share fresh pattern examples and trading strategies.
These networks also keep traders updated on macroeconomic events affecting price actions, such as CBN policy changes or fuel scarcity that impact market sentiment. Learning through peer exchanges and mentorships can accelerate progress beyond what self-study offers.
Using the right resources and practising with local data boosts your confidence and improves your ability to spot profitable chart patterns in Nigeria’s dynamic markets. Get connected, stay disciplined, and continuously sharpen your skills.
📈 Learn to spot key bullish candlestick patterns for smarter trading in Nigerian and global markets. Discover how to combine these insights to manage risks and boost your ₦ gains.

📉 Learn how bearish candlestick patterns signal possible market dips. Get tips to spot, interpret, and use them smartly in trading decisions.
📊 Discover 7 key chart patterns every trader should know for smarter market moves. Understand their traits, psychology, and get a handy PDF guide!

Explore the best trading apps in Nigeria 📱 for stocks, forex, and crypto. Get tips on choosing reliable platforms and earning money safely as a beginner.
Based on 14 reviews