

How Forex Trading Works for Nigerian Investors
📈 Learn how forex trading works for Nigerian investors 🇳🇬, including practical steps, risk tips, and navigating ₦ to maximise your profits in the forex market.
Edited By
Sophia Bennett
Trading chart patterns are essential tools for anyone serious about investing or trading, especially in Nigeria's dynamic financial markets. These patterns help traders and investors identify potential market movements before they happen, giving an edge in buying or selling decisions.
At its core, a trading chart pattern is a visual representation on price charts that signals future price direction. Traders look for recurring shapes—like triangles, flags, or head and shoulders—to predict whether an asset's price will go up or down. Understanding these patterns can help you spot entry and exit points for various assets, from stocks listed on the Nigerian Stock Exchange (NGX) to forex pairs involving the naira.

For instance, a "double bottom" pattern typically suggests a strong support level where prices may bounce back after a dip. Imagine a stock on NGX falling to ₦150 twice but refusing to drop lower; this could indicate a buying opportunity. Conversely, a "rising wedge" pattern might warn of a potential price decline, signalling that traders should consider selling.
Recognising chart patterns gives you a practical edge, allowing timely decisions rather than reacting to market noise.
Here are some reasons why Nigerian traders should pay close attention to chart patterns:
Predictive Power: They help forecast market direction based on historical price data.
Risk Management: Patterns often point to where to place stop-loss orders to limit losses.
Timing Trades: Unlike relying on fundamentals alone, chart patterns provide precise timing cues.
Versatility: Applicable to stocks, forex, commodities, and cryptocurrencies in Nigeria.
While chart patterns offer valuable information, they are not foolproof. Market conditions, news events, or unexpected economic shifts can invalidate these setups. Therefore, it’s important to combine pattern analysis with other indicators or techniques.
In the following sections, we'll explore the main types of chart patterns, practical ways to interpret them, and how you can apply this knowledge in Nigeria’s markets to improve trading results. You’ll also get tips on avoiding common pitfalls and managing risks effectively.
Trading chart patterns serve as vital tools enabling traders and investors to decode price movements and predict market behaviour. In Nigeria, where market volatility and liquidity vary widely across sectors, understanding chart patterns helps you make smarter decisions, whether trading equities on the Nigerian Exchange (NGX) or dealing in forex pairs involving the naira.
Trading chart patterns are shapes and formations drawn by price movements on a chart, representing the psychology of market participants over time. These patterns emerge from the collective actions of buyers and sellers, reflecting supply and demand dynamics. For example, a "Head and Shoulders" pattern often signals a potential trend reversal — it forms when the price peaks form three distinct highs, with the middle peak higher than the others, indicating weakening momentum.
Visualising these patterns lets you spot when a trend might pause, reverse, or continue, enhancing your timing for entry and exit points. Think of it like recognising familiar landmarks on a road trip; once you know what to look out for, navigating becomes easier and less risky.
Chart patterns matter because they provide clues about market sentiment before prices shift significantly. Unlike depending solely on gut feeling or news headlines, patterns offer a method grounded in historical price behaviour. When combined with volume data and trend lines, chart patterns sharpen your trade signals.
For instance, a Nigerian trader observing a "Double Bottom" pattern in the shares of a prominent company like Dangote Cement might prepare for an upward price move, based on past pattern reliability. Similarly, forex traders watching naira/USD pairs can use patterns to anticipate when the Central Bank of Nigeria's (CBN) policies might influence currency shifts.
Successfully trading chart patterns can reduce guesswork and improve your chance of capitalising on profitable moves, but it requires practice and attention to detail.
Knowing these patterns is especially beneficial in Nigerian markets where sudden regulatory announcements or naira fluctuations can trigger sharp price reactions. Chart patterns act as a guide to prepare and react better, helping you avoid costly mistakes and potentially increase your gains.
In summary, mastering chart patterns equips you with a clearer lens into market psychology, allowing you to navigate investments more confidently amidst Nigeria's unique trading environment.
Understanding common chart patterns is essential for traders and investors aiming to predict market movements and make informed decisions. These patterns signal potential shifts or continuation in price action, helping you time when to enter or exit trades. Nigerian markets, including equities and forex, present unique dynamics where spotting these patterns can improve your trading edge.
The Head and Shoulders pattern typically marks a reversal from a bullish to bearish trend or vice versa. It forms when a peak (shoulder) is followed by a higher peak (head) and then another lower peak (shoulder). For instance, in the Nigerian Stock Exchange (NGX), if a stock shows this formation after a strong upward rally, it suggests the trend might soon reverse downward. Traders watching this pattern often set stop-loss orders just above the right shoulder to limit losses if the expected reversal doesn’t happen.

Double Tops and Double Bottoms signal trend reversals with a straightforward structure. A Double Top appears as two successive peaks at roughly the same price level, indicating resistance. Similarly, a Double Bottom shows two near-equal troughs, suggesting strong support. For example, if a forex pair like USD/NGN forms a Double Bottom after a drop, it may indicate a bullish reversal. Identifying this pattern early enables traders to position themselves ahead of the next price move.
Triangles reflect consolidation before a trend continues. Symmetrical triangles, where price narrows between converging trendlines, suggest indecision before the movement picks a direction. Ascending triangles are bullish, showing rising support, while descending triangles point to bearish continuation with falling resistance. Nigerian traders often observe such patterns on shares affected by external factors like Naira volatility, where price prepares for a breakout following consolidation.
Flags and pennants appear after sharp price moves and represent short pauses before the trend resumes. Flags look like small rectangles slanting against the trend, while pennants form small symmetrical triangles. For instance, a stock that surges after positive earnings might form a flag as traders catch their breath before the buying interest continues. Recognising these patterns helps you hold positions confidently rather than exiting prematurely.
Rectangles, also called trading ranges, form when prices move sideways between horizontal support and resistance levels. This pattern suggests a balance between buyers and sellers before the next breakout. In Nigeria’s equities market, stocks with low liquidity may spend extended periods in rectangle formations. Trading these involves buying near support and selling near resistance, but cautious traders wait for clear breakouts to avoid false moves.
Recognising and understanding these common chart patterns can significantly sharpen trading strategies. Applying them in the Nigerian market context, with considerations for local volatility and liquidity, increases your chances of making profitable trades.
Reversal patterns alert you to likely trend changes.
Continuation patterns signal pauses before trends resume.
Bilateral patterns prepare traders for breakouts in either direction.
Mastering these gives Nigerian traders the practical tools to read market signals effectively and manage risks appropriately.
Understanding how to read and interpret chart patterns is essential for traders looking to make informed decisions in both equities and forex markets. Chart patterns can reveal shifts in market sentiment, possible trend reversals, or continuations. However, relying on patterns alone may mislead; interpreting them alongside other key indicators improves accuracy and timing.
Volume Analysis plays a vital role in validating chart patterns. Volume refers to the number of shares or contracts traded during a given period. For example, when a breakout occurs in a head and shoulders pattern, a significant increase in volume confirms strong buying or selling interest. In contrast, a breakout accompanied by low volume often signals a false move, making it riskier for traders to act. Nigerian markets, like the NGX, can sometimes have low liquidity, so volume spikes become even more critical to watch.
Support and Resistance Levels help categorise price zones where the market tends to pause or reverse. Support indicates a price level where demand is strong enough to prevent the price from falling further, while resistance marks a ceiling where selling pressure mounts. Chart patterns like double tops or bottoms often form around these levels. For instance, if a double bottom forms near a long-standing support line on Nigerian banking stocks, it strengthens the likelihood of a price rebound, offering a clearer entry point for investors.
Trend Lines connect significant highs or lows on a chart, outlining the general market direction. They serve as dynamic support or resistance. A rising trend line suggests bullish momentum, while a descending one indicates bearish pressure. Pairing trend lines with chart patterns allows traders to identify breakout or breakdown points more confidently. For example, an ascending triangle pattern coupled with a rising trend line in forex markets like USD/NGN can signal strong upside potential.
Knowing when to enter or exit a trade is as important as spotting the pattern itself. A common approach is to wait for confirmation signals—such as a breakout on increased volume beyond resistance or support levels—before opening a position. Exiting typically involves setting stop-loss orders just below key support levels or trend lines to manage risk. For example, a trader investing in equities like MTN Nigeria might enter on a confirmed breakout and place a stop-loss slightly below a recent low to protect against unexpected reversals.
Combining chart patterns with volume, support/resistance, and trend lines sharpens your market edge. Timing your moves based on these indicators reduces guesswork and helps manage risks in the often volatile Nigerian markets.
Being patient and disciplined with these signals can boost your trading outcomes, especially given economic factors like naira volatility and local market liquidity. Remember, no indicator guarantees success—always combine technical insight with sound risk management practices.
For traders and investors operating in Nigeria, understanding local market realities is vital to effectively apply trading chart patterns. Unlike more developed markets with stable conditions and abundant liquidity, Nigerian financial markets bring their own unique challenges. Recognising these specifics can improve decision-making and reduce costly mistakes.
Liquidity in Nigeria's equities and forex markets is often inconsistent, particularly for less popular stocks or currency pairs. This means price movements might reflect thin trading rather than genuine market sentiment. For example, a sudden spike in a small-cap stock on the Nigerian Exchange Group (NGX) may simply be one large trade, not a reliable trend indicated by a chart pattern.
These liquidity gaps can cause false signals where chart patterns appear complete but fail to result in expected price movements. Nigerian traders need to cross-check volume data carefully, avoiding reliance on patterns formed in low-volume conditions. This caution helps prevent getting caught in traps set by erratic price behaviour driven by scarce participants.
The naira’s fluctuating value significantly impacts chart patterns, especially in forex and stocks sensitive to import costs or foreign investment flows. Sudden government policy shifts or central bank interventions can cause sharp, unanticipated price swings.
For instance, the Central Bank of Nigeria's (CBN) periodic changes to the official exchange rate often send ripple effects across sectors, making standard chart patterns less predictable. Traders should combine chart analysis with currency trend insights and CBN policy announcements to anticipate such disruptions properly.
Nigeria's regulatory environment and news events intensely influence market behaviour. Announcements from bodies like the Securities and Exchange Commission (SEC) or fiscal policy changes by the Federal Inland Revenue Service (FIRS) can nullify chart patterns overnight.
Moreover, news—ranging from election outcomes to fuel subsidy adjustments—can create sudden volatility that renders chart setups ineffective. Nigerian traders are wise to monitor local financial news closely, blending fundamental awareness with technical patterns for better timing.
Successful trading in Nigeria requires blending chart pattern insights with a firm grasp of local market factors like liquidity, naira volatility, and regulatory developments.
Trading chart patterns apply differently across Nigerian equities and forex markets. In the equities space, popular stocks such as MTN Nigeria, Dangote Cement, or Zenith Bank generally show more reliable patterns due to heavier trading volumes. However, for mid and small-cap stocks, patterns can be misleading without volume confirmation.
On the forex front, pairs involving the naira (NGN/USD, NGN/EUR) exhibit higher volatility influenced by both domestic policies and global currency movements. Chart patterns such as triangles or flags may complete but break unpredictably if, for instance, the CBN intervenes or foreign portfolio investors react to external events.
Traders should use chart patterns alongside:
Volume indicators to confirm pattern strength in equities
News and economic calendar events impacting forex pairs
Support and resistance levels derived from Nigerian market history
Understanding how these factors interplay helps Nigerian traders make smarter entry and exit decisions, reducing guesswork and improving confidence in a challenging market environment.
Trading chart patterns provide valuable clues about market trends, but they come with risks and limitations that every trader should understand. Overreliance on patterns without considering their imperfections can lead to costly mistakes, especially in volatile markets like Nigeria's equities and forex.
Chart patterns do not always produce reliable outcomes. False signals—where a pattern suggests a price move but the market goes the opposite way—are common. For example, a head and shoulders pattern might indicate a trend reversal, yet the price could instead continue its original direction. This failure to confirm can erode trust in chart analysis and lead to losses.
False signals often arise during periods of low liquidity or sharp market reactions to unexpected news. Nigerian markets, with their limited liquidity at times and sensitivity to political or economic developments, experience these disruptions severally. To illustrate, during a sudden naira devaluation or a surprise regulatory change, charts may show breakouts or breakdowns that quickly reverse, misleading traders.
Fundamental Analysis plays a crucial role in validating chart patterns. While technical analysis focuses on price and volume data, fundamental analysis looks at economic indicators, company financials, or forex supply-demand factors that may affect price movements. For instance, if a bullish flag pattern appears in the shares of a Nigerian bank, checking the bank’s quarterly earnings or CBN policy updates can help confirm whether the pattern’s predicted rise is likely. Integrating these insights reduces the chance of acting on misleading chart signals alone.
Risk Management Techniques are essential to handle chart pattern uncertainty. Setting stop-loss orders limits potential losses if a trade does not go as planned. Many traders use position sizing to ensure no single trade can wipe out their capital. For example, a trader entering Oil and Gas equities via a double bottom pattern may decide to risk just 2% of their portfolio value on the trade. Also, combining pattern signals with volume spikes or momentum indicators can improve timing, allowing exit before heavy losses.
Traders succeed by seeing chart patterns as probabilistic clues, not guarantees. Mixing patterns with solid fundamental checks and strict risk controls builds a more resilient trading strategy.
Ultimately, chart patterns offer insights but should be one part of a broader trading toolkit that respects market realities and Nigerian trading conditions.
📈 Learn how forex trading works for Nigerian investors 🇳🇬, including practical steps, risk tips, and navigating ₦ to maximise your profits in the forex market.

Discover why forex trading is a smart move for Nigerian investors 🇳🇬. Benefit from flexible hours, easy market access, and real profit chances 📈💰.
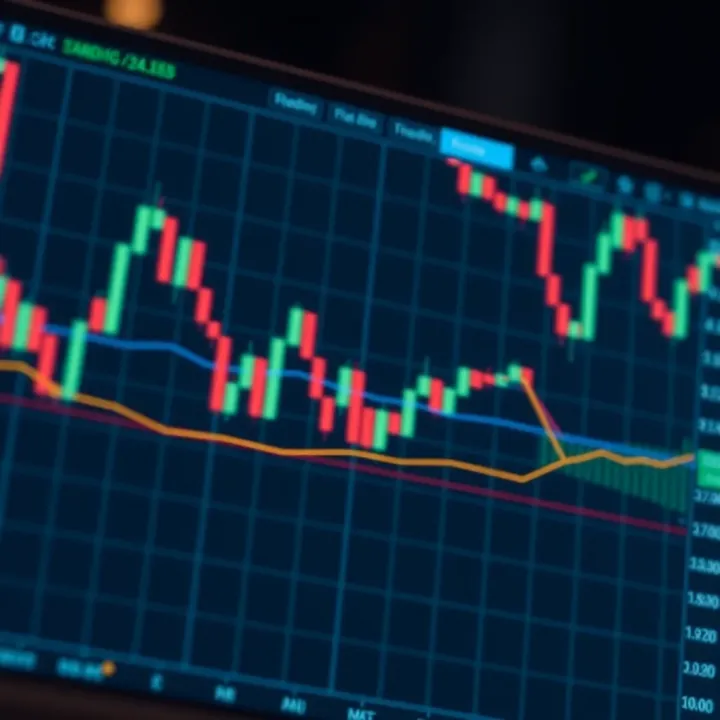
📊 Discover 7 key chart patterns every trader should know for smarter market moves. Understand their traits, psychology, and get a handy PDF guide!

📈 Learn to spot key bullish candlestick patterns for smarter trading in Nigerian and global markets. Discover how to combine these insights to manage risks and boost your ₦ gains.
Based on 15 reviews